- Home
- :
- All Communities
- :
- Developers
- :
- JavaScript Maps SDK
- :
- JavaScript Maps SDK Questions
- :
- Re: InfoTemplate Contents for Graphics are not vis...
- Subscribe to RSS Feed
- Mark Topic as New
- Mark Topic as Read
- Float this Topic for Current User
- Bookmark
- Subscribe
- Mute
- Printer Friendly Page
InfoTemplate Contents for Graphics are not visible after first click - only on IE
- Mark as New
- Bookmark
- Subscribe
- Mute
- Subscribe to RSS Feed
- Permalink
We are using "esri/InfoTemplate" to show infowindow for the Graphics.
And when we are setting any Node (element) as the content for infoTemplate we can see the infowindow properly only for first time , however next time onward when we click on same graphic the blank infowindow is shown.
Following are our observations:
- If string is set as the content for InfoTemplate then the infowindow is always shown properly.
- If an element is set as the content for InfoTemplate and when we click on the graphics for first time we can see the infowindow as expected. However from next click on the graphic the innerHTML of element(which is set as content) gets cleared(Empty).
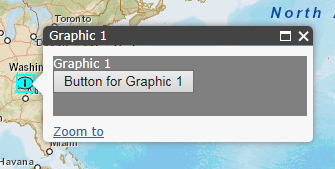
Infowindow content when graphic is clicked for first time:
Infowindow content when same graphic is clicked for second time:

Below is the code Sample:
<!DOCTYPE html>
<html>
<head>
    <meta http-equiv="Content-Type" content="text/html; charset=utf-8">
    <!--The viewport meta tag is used to improve the presentation and behavior of the samples
      on iOS devices-->
    <meta name="viewport" content="initial-scale=1, maximum-scale=1,user-scalable=no">
    <title>Graphic InfoTemplate sample</title>
    <link rel="stylesheet" href="http://js.arcgis.com/3.13/esri/css/esri.css">
    <style>
        html, body, #mapDiv
        {
            padding: 0;
            margin: 0;
            height: 100%;
        }
        button
        {
            display: block;
        }
    </style>
    <script src="http://js.arcgis.com/3.13/"></script>
    <script>
        var map;
        require([
        "esri/map",
        "esri/symbols/SimpleMarkerSymbol",
        "esri/InfoTemplate",
        "esri/graphic",
        "esri/Color", "dojo/dom", "dojo/dom-construct", "dojo/on", "dojo/domReady!"
      ], function (
        Map,
        SimpleMarkerSymbol,
        InfoTemplate,
        Graphic,
        Color, dom, domConstruct, on
      ) {
   //create symbol for graphic
          var markerSymbol = new SimpleMarkerSymbol();
          markerSymbol.setPath("M16,4.938c-7.732,0-14,4.701-14,10.5c0,1.981,0.741,3.833,2.016,5.414L2,25.272l5.613-1.44c2.339,1.316,5.237,2.106,8.387,2.106c7.732,0,14-4.701,14-10.5S23.732,4.938,16,4.938zM16.868,21.375h-1.969v-1.889h1.969V21.375zM16.772,18.094h-1.777l-0.176-8.083h2.113L16.772,18.094z");
          markerSymbol.setColor(new Color("#00FFFF"));

          var count = 1;//by default set graphic count to 1
          //create map
          map = new Map("mapDiv", { basemap: "streets", center: [-25.312, 34.307], zoom: 3});
          map.on("click", addGraphic);


          function addGraphic(evt) {
              var graphic, infoTemplate, templateDiv, templateButton;
              if (evt.graphic) {
                  //display infowindow if graphic is clicked.
                  map.infoWindow.show();
              } else {
                  //create new graphic
                  graphic = new Graphic(evt.mapPoint, markerSymbol);
                  //create info template for graphic
                  infoTemplate = new InfoTemplate();

                  infoTemplate.setTitle("Graphic " + count);
   //create template containing DOM node
                  templateDiv = domConstruct.create("div", { "style": "background-color:grey; color:white; height:60px", 'innerHTML': "Graphic " + count }, null);
                  templateButton = domConstruct.create("button", {  'innerHTML': "Button for Graphic " + count }, templateDiv);
   //set Content
   infoTemplate.setContent(templateDiv);

   //set infoTemplate to graphic
                  graphic.setInfoTemplate(infoTemplate);

   //Add Graphics on map
                  map.graphics.add(graphic);
                  count++;
              }
          }
      });
    </script>
</head>
<body>
    <div id="mapDiv">
    </div>
</body>
</html>
Steps to reproduce:
1.Click on map to add the graphics.
2.Now click on the graphic. (observe that you will see the text "Graphic 1" and a Button) :
3. Close the infowindow
4.Now click on the same graphic again. (observe that you will not see the text and Button) :
- Mark as New
- Bookmark
- Subscribe
- Mute
- Subscribe to RSS Feed
- Permalink
Sumit,
Can you share a quick sample that shows how you are setting the content for the InfoTemplate?
- Mark as New
- Bookmark
- Subscribe
- Mute
- Subscribe to RSS Feed
- Permalink
<!DOCTYPE html>
<html>
<head>
    <meta http-equiv="Content-Type" content="text/html; charset=utf-8">
    <!--The viewport meta tag is used to improve the presentation and behavior of the samples
      on iOS devices-->
    <meta name="viewport" content="initial-scale=1, maximum-scale=1,user-scalable=no">
    <title>Graphic InfoTemplate sample</title>
    <link rel="stylesheet" href="http://js.arcgis.com/3.13/esri/css/esri.css">
    <style>
        html, body, #mapDiv
        {
            padding: 0;
            margin: 0;
            height: 100%;
        }
        button
        {
            display: block;
        }
    </style>
    <script src="http://js.arcgis.com/3.13/"></script>
    <script>
        var map;
        require([
        "esri/map",
        "esri/symbols/SimpleMarkerSymbol",
        "esri/InfoTemplate",
        "esri/graphic",
        "esri/Color", "dojo/dom", "dojo/dom-construct", "dojo/on", "dojo/domReady!"
      ], function (
        Map,
        SimpleMarkerSymbol,
        InfoTemplate,
        Graphic,
        Color, dom, domConstruct, on
      ) {
   //create symbol for graphic
          var markerSymbol = new SimpleMarkerSymbol();
          markerSymbol.setPath("M16,4.938c-7.732,0-14,4.701-14,10.5c0,1.981,0.741,3.833,2.016,5.414L2,25.272l5.613-1.44c2.339,1.316,5.237,2.106,8.387,2.106c7.732,0,14-4.701,14-10.5S23.732,4.938,16,4.938zM16.868,21.375h-1.969v-1.889h1.969V21.375zM16.772,18.094h-1.777l-0.176-8.083h2.113L16.772,18.094z");
          markerSymbol.setColor(new Color("#00FFFF"));

          var count = 1;//by default set graphic count to 1
          //create map
          map = new Map("mapDiv", { basemap: "streets", center: [-25.312, 34.307], zoom: 3});
          map.on("click", addGraphic);


          function addGraphic(evt) {
              var graphic, infoTemplate, templateDiv, templateButton;
              if (evt.graphic) {
                  //display infowindow if graphic is clicked.
                  map.infoWindow.show();
              } else {
                  //create new graphic
                  graphic = new Graphic(evt.mapPoint, markerSymbol);
                  //create info template for graphic
                  infoTemplate = new InfoTemplate();

                  infoTemplate.setTitle("Graphic " + count);
   //create template containing DOM node
                  templateDiv = domConstruct.create("div", { "style": "background-color:grey; color:white; height:60px", 'innerHTML': "Graphic " + count }, null);
                  templateButton = domConstruct.create("button", {  'innerHTML': "Button for Graphic " + count }, templateDiv);
   //set Content
   infoTemplate.setContent(templateDiv);

   //set infoTemplate to graphic
                  graphic.setInfoTemplate(infoTemplate);

   //Add Graphics on map
                  map.graphics.add(graphic);
                  count++;
              }
          }
      });
    </script>
</head>
<body>
    <div id="mapDiv">
    </div>
</body>
</html>
- Mark as New
- Bookmark
- Subscribe
- Mute
- Subscribe to RSS Feed
- Permalink
Hello Sumit,
the infoTemplate.setContent takes string | Function try
infoTemplate.setContent(templateDiv.outerHTML);
- Mark as New
- Bookmark
- Subscribe
- Mute
- Subscribe to RSS Feed
- Permalink
I tried that but when we set outerHTML, events are not working. for e.g Click event for the button.
- Mark as New
- Bookmark
- Subscribe
- Mute
- Subscribe to RSS Feed
- Permalink
Your example did not have any events. Is the button visible as expected?
my point is that you need to build proper template string and not use dom-construct.
- Mark as New
- Bookmark
- Subscribe
- Mute
- Subscribe to RSS Feed
- Permalink
thejus kambi As a part of business requirement we need to show the button in the infowindow and clciking on which the widget needs to handle some functionality.
I can create the template with outerHTML(string) but then how should I handle the click event in the Widget.
Also how should i maintain the scope of the widget(this) when calling the event handler.
- Mark as New
- Bookmark
- Subscribe
- Mute
- Subscribe to RSS Feed
- Permalink
From what you mentioned, I assume you need to pass some specific values to the button click event, values from graphics. Is my understanding correct? In that case you can use a function instead of node
infoTemplate.setContent(setTemplateContent);
var Count = 0;
function setTemplateContent(graphic) {
     var objectId = graphic.attributes['OBJECTID'];
     Count++;
     return  '<div  style="background-color:grey;color:white; height:60px">Graphic ' + Count +
             '<button onclick=\"buttonClick(' + objectId  + ')\" >Button for Graphic ' + Count + '</button>' +
             '</div>'
}

function buttonClick(objId){
     // your code here
}
something like this. please note, the above code is not tested
- Mark as New
- Bookmark
- Subscribe
- Mute
- Subscribe to RSS Feed
- Permalink
Thanks thejus kambi
But as we are creating custom widget for webapp Builder it would not possible for us to follow the above approach, as we cannot write method outside the widget.
It would be helpful if you suggest any approach to call the function within the widget without using dom-construct.
Also as the graphic which we are creating are being added on graphics layer and not on feature layer these graphics don't have the unique Object id to identify.
- Mark as New
- Bookmark
- Subscribe
- Mute
- Subscribe to RSS Feed
- Permalink
Sumit,
Using your code provided unmodified in Google Chrome I can not reproduce your issue. Each time I click on the map a new graphic is created and then and when I click on the graphic I get a info window with the button each time (even when closing the info window and clicking on the same exact graphic again).