Turn on suggestions
Auto-suggest helps you quickly narrow down your search results by suggesting possible matches as you type.
Cancel
- Home
- :
- All Communities
- :
- Developers
- :
- JavaScript Maps SDK
- :
- JavaScript Maps SDK Questions
- :
- How To Render Layer By Unique Value Without Hard C...
Options
- Subscribe to RSS Feed
- Mark Topic as New
- Mark Topic as Read
- Float this Topic for Current User
- Bookmark
- Subscribe
- Mute
- Printer Friendly Page
How To Render Layer By Unique Value Without Hard Coding the Values
Subscribe
12-07-2012
10:02 AM
- Mark as New
- Bookmark
- Subscribe
- Mute
- Subscribe to RSS Feed
- Permalink
Javascript API 3.2 ArcGIS Server 10.1
Greetings,
I am new to the Javascript API (JSAPI), and am trying not to get bogged down with what should be very basic and easy by now. But, nonetheless, here I am . . .
I would like to symbolize selected features in a polygon layer by unique value without hard-coding all of the values.
I also want to be sure that the colors are as distinguishable as possible depending on the quantity of unique values (in other words, not render 15 values in 15 shades of green, but render via an algorithm that does a better job than just random color generation).
The only unique-value renderer example I could find for JSAPI was here ----- http://help.arcgis.com/en/webapi/javascript/arcgis/help/jssamples_start.htm#jssamples/renderer_uniqu... ----- but it only shows how to do this by hard-coding each value.
I've been searching the web for a solution, but found none as of yet. I've also been banging my head with ESRI support, but the answer I finally got was that there is no such thing as an ESRI unique value renderer for JSAPI and that I will have to hard code all of the values manually and write a bunch of Javascript to sort out any duplicates. That just doesn't seem reasonable to me since rendering a selected set of polygons by unique value is fundamental GIS - basic thematic mapping that we've been doing for many years.
I just know there are many out there doing this successfully. Any guidance would be appreciated.
Thanks.
-Dan
Solved! Go to Solution.
1 Solution
Accepted Solutions
12-10-2012
10:04 AM
- Mark as New
- Bookmark
- Subscribe
- Mute
- Subscribe to RSS Feed
- Permalink
Are you sure you want to try to show hundreds of different colors on a map? Once you start showing more than six or seven colors it's hard to differentiate between them. I would re-consider showing each feature as a unique color.
If you're using ArcGIS Server 10.1 you can use the generate renderer endpoint to build a renderer from your data. We have a sample that shows how to request a class breaks renderer using this functionality. You could do the same thing, but use a UniqueValueDefinition instead of a ClassBreaksDefinition.
Here's a modified version of our sample that uses a UniqueValueDefinition to give each county a unique symbol based on the NAME attribute from the layer: http://jsfiddle.net/nKzUp/
12 Replies
12-07-2012
01:57 PM
- Mark as New
- Bookmark
- Subscribe
- Mute
- Subscribe to RSS Feed
- Permalink
Hi Dan,
You're right in that the API puts it on the developer to sort out values for a unique value renderer. If you're coming from ArcGIS Desktop, this probably seems like a lot of work. But it can be done with a few lines of JS code. Here's a modified version of the unique value renderer sample that gets unique values for a field, generates a color ramp and then builds a unique value renderer using the unique values and colors from the ramp:
On JSFiddle: http://jsfiddle.net/xgzT2/
You're right in that the API puts it on the developer to sort out values for a unique value renderer. If you're coming from ArcGIS Desktop, this probably seems like a lot of work. But it can be done with a few lines of JS code. Here's a modified version of the unique value renderer sample that gets unique values for a field, generates a color ramp and then builds a unique value renderer using the unique values and colors from the ramp:
<!DOCTYPE html>
<html>
  <head>
    <meta http-equiv="Content-Type" content="text/html; charset=utf-8">
    <meta http-equiv="X-UA-Compatible" content="IE=7,IE=9">
    <meta name="viewport" content="initial-scale=1, maximum-scale=1,user-scalable=no"/>
    <title>Unique Value Renderer</title>
    <link rel="stylesheet" href="http://serverapi.arcgisonline.com/jsapi/arcgis/3.2/js/dojo/dijit/themes/claro/claro.css">
    <link rel="stylesheet" href="http://serverapi.arcgisonline.com/jsapi/arcgis/3.2/js/esri/css/esri.css">

    <script>var dojoConfig = { parseOnLoad: true };</script>
    <script src="http://serverapi.arcgisonline.com/jsapi/arcgis/?v=3.2"></script>
    <script>
      dojo.require("esri.map");
      dojo.require("esri.layers.FeatureLayer");
      var map;

      dojo.ready(function() {
        var bounds = new esri.geometry.Extent({"xmin":-14558502,"ymin":2799695,"xmax":-6731350,"ymax":6713271,"spatialReference":{"wkid":102100}});
        map = new esri.Map("map", {
          extent: bounds,
          slider: false
        });
        map.addLayer(new esri.layers.ArcGISTiledMapServiceLayer("http://server.arcgisonline.com/ArcGIS/rest/services/World_Street_Map/MapServer"));

        var defaultSymbol = new esri.symbol.SimpleFillSymbol().setStyle("none");
        defaultSymbol.outline.setStyle("none");

        // query for attribute values then find uniques
        var layerUrl = "http://sampleserver1.arcgisonline.com/ArcGIS/rest/services/Specialty/ESRI_StateCityHighway_USA/MapServer/1";
        var field = "SUB_REGION";
        var qt = new esri.tasks.QueryTask(layerUrl);
        var q = new esri.tasks.Query();
        q.returnGeometry = false;
        q.outFields = [ field ];
        q.where = "1=1";
        var result = qt.execute(q);
        result.then(function(response) {
          var uniques = [];
          dojo.forEach(response.features, function(f) {
            if ( dojo.indexOf(uniques, f.attributes[field]) === -1 ) {
              uniques.push(f.attributes[field]);
            }
          });
          // generate a color ramp
          var ramp = createRamp(uniques.length);
          //create renderer
          var renderer = new esri.renderer.UniqueValueRenderer(defaultSymbol, field);
          // add values to the renderer with symbols using colors from the color ramp
          dojo.forEach(ramp, function(c, idx) {
            var symbol = new esri.symbol.SimpleFillSymbol().setColor(new dojo.Color(c));
            // symbol.outline.setColor(c);
            renderer.addValue(uniques[idx], symbol)
          });
          // create the feature layer
          var featureLayer = new esri.layers.FeatureLayer(layerUrl, {
            mode: esri.layers.FeatureLayer.MODE_ONDEMAND,
            outFields: [ field ]
          });
          featureLayer.setRenderer(renderer);
          // finally, add the layer to the map
          map.addLayer(featureLayer);
          console.log("added feature layer");
        }, function(err) {
          console.log("query task to get attributes failed");
        });

        function createRamp(count) {
          var index = 0;
          var factor = parseInt(360/count);
          var colors = [];
          while ( index < count ) {
            var hue = index * factor
            colors.push(color_from_hue(hue));
            index += 1;
          }
          return colors;
        }

        // source:  http://rainbowcoding.com/how-to-create-rainbow-text-in-html-css-javascript/
        function color_from_hue(hue) {
          var h = hue/60;
          var c = 255;
          var x = (1 - Math.abs(h%2 - 1))*255;
          var color;

          var i = Math.floor(h);
          if (i == 0) color = rgb_to_hex(c, x, 0);
          else if (i == 1) color = rgb_to_hex(x, c, 0);
          else if (i == 2) color = rgb_to_hex(0, c, x);
          else if (i == 3) color = rgb_to_hex(0, x, c);
          else if (i == 4) color = rgb_to_hex(x, 0, c);
          else color = rgb_to_hex(c, 0, x);

          return color;
        }

        function rgb_to_hex(red, green, blue) {
          var h = ((red << 16) | (green << 8) | (blue)).toString(16);
          // add the beginning zeros
          while (h.length < 6) h = '0' + h;
          return '#' + h;
        } // end functions from rainbowcoding.com
      });
    </script>
  </head>

  <body>
    <div id="map" class="claro" style="width:800px; height:400px; border:1px solid #000;"></div>
  </body>
</html>
On JSFiddle: http://jsfiddle.net/xgzT2/
12-10-2012
04:29 AM
- Mark as New
- Bookmark
- Subscribe
- Mute
- Subscribe to RSS Feed
- Permalink
Hi Derek,
Thanks for responding.
I recently discovered the UniqueValueDefinition here: http://help.arcgis.com/en/webapi/javascript/arcgis/help/jsapi_start.htm#jsapi/uniquevaluedefinition....
What are your thoughts on it?
-Dan
Thanks for responding.
I recently discovered the UniqueValueDefinition here: http://help.arcgis.com/en/webapi/javascript/arcgis/help/jsapi_start.htm#jsapi/uniquevaluedefinition....
What are your thoughts on it?
-Dan
12-10-2012
08:06 AM
- Mark as New
- Bookmark
- Subscribe
- Mute
- Subscribe to RSS Feed
- Permalink
Hi Derek,
I am using your example now, but having a few problems . . .
My test layer has 1416 features and I have set MaxRecordsCount in ArcGIS Server Manager to 500000 for this layer just to be sure that I get all of the features to render for my test.
When I render on a field that has, say, 36 unique values, it renders them, albeit not so uniquely (various shades of similar colors - image below):
(Click to enlarge image to full size)
[ATTACH=CONFIG]19824[/ATTACH]
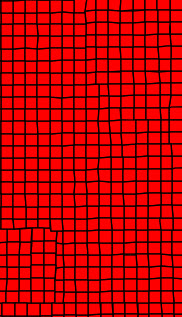
When I render on a field that has, say, 1416 unique values, it renders in all one color (image below):
(Click to enlarge image to full size)
[ATTACH=CONFIG]19826[/ATTACH]
To check the unique values, I output them into a div (see your code below, modified with bold code)
dojo.forEach(response.features, function (f) {
if (dojo.indexOf(uniques, f.attributes[field]) === -1) {
uniques.push(f.attributes[field]);
dojo.byId('divTopPanel').innerHTML += f.attributes[field] + ' ';
}
});
I can see that I am getting unique values from the loop, but my map does not render them uniquely.
So, two problems:
1. Colors are not unique enough (need to add tans, grays, etc to provide more unique colors)
2. Features all render the same color at some threshold of unique value quantities.
Got any suggestions?
-Dan
(PS: Have you any suggestions for using UniqueValueDefinition?)
I am using your example now, but having a few problems . . .
My test layer has 1416 features and I have set MaxRecordsCount in ArcGIS Server Manager to 500000 for this layer just to be sure that I get all of the features to render for my test.
When I render on a field that has, say, 36 unique values, it renders them, albeit not so uniquely (various shades of similar colors - image below):
(Click to enlarge image to full size)
[ATTACH=CONFIG]19824[/ATTACH]
When I render on a field that has, say, 1416 unique values, it renders in all one color (image below):
(Click to enlarge image to full size)
[ATTACH=CONFIG]19826[/ATTACH]
To check the unique values, I output them into a div (see your code below, modified with bold code)
dojo.forEach(response.features, function (f) {
if (dojo.indexOf(uniques, f.attributes[field]) === -1) {
uniques.push(f.attributes[field]);
dojo.byId('divTopPanel').innerHTML += f.attributes[field] + ' ';
}
});
I can see that I am getting unique values from the loop, but my map does not render them uniquely.
So, two problems:
1. Colors are not unique enough (need to add tans, grays, etc to provide more unique colors)
2. Features all render the same color at some threshold of unique value quantities.
Got any suggestions?
-Dan
(PS: Have you any suggestions for using UniqueValueDefinition?)
12-10-2012
08:52 AM
- Mark as New
- Bookmark
- Subscribe
- Mute
- Subscribe to RSS Feed
- Permalink
Features all render the same color at some threshold of unique value quantities.
I think the problem is with the following function:
function createRamp(count) {
var index = 0;
var factor = parseInt(360 / count);
var colors = [];
while (index < count) {
var hue = index * factor
colors.push(color_from_hue(hue));
index += 1;
}
return colors;
}
If the 'count' is too high, the factor is too small to make a significant difference.
Time to look at the UniqueValueDefinition?
12-10-2012
08:53 AM
- Mark as New
- Bookmark
- Subscribe
- Mute
- Subscribe to RSS Feed
- Permalink
Features all render the same color at some threshold of unique value quantities.
I think the problem is with the following function:
function createRamp(count) {
var index = 0;
var factor = parseInt(360 / count);
var colors = [];
while (index < count) {
var hue = index * factor
colors.push(color_from_hue(hue));
index += 1;
}
return colors;
}
If the 'count' is too high, the factor is too small to make a significant difference.
Time to look at the UniqueValueDefinition?
12-10-2012
10:04 AM
- Mark as New
- Bookmark
- Subscribe
- Mute
- Subscribe to RSS Feed
- Permalink
Are you sure you want to try to show hundreds of different colors on a map? Once you start showing more than six or seven colors it's hard to differentiate between them. I would re-consider showing each feature as a unique color.
If you're using ArcGIS Server 10.1 you can use the generate renderer endpoint to build a renderer from your data. We have a sample that shows how to request a class breaks renderer using this functionality. You could do the same thing, but use a UniqueValueDefinition instead of a ClassBreaksDefinition.
Here's a modified version of our sample that uses a UniqueValueDefinition to give each county a unique symbol based on the NAME attribute from the layer: http://jsfiddle.net/nKzUp/
If you're using ArcGIS Server 10.1 you can use the generate renderer endpoint to build a renderer from your data. We have a sample that shows how to request a class breaks renderer using this functionality. You could do the same thing, but use a UniqueValueDefinition instead of a ClassBreaksDefinition.
Here's a modified version of our sample that uses a UniqueValueDefinition to give each county a unique symbol based on the NAME attribute from the layer: http://jsfiddle.net/nKzUp/
12-10-2012
10:15 AM
- Mark as New
- Bookmark
- Subscribe
- Mute
- Subscribe to RSS Feed
- Permalink
Are you sure you want to try to show hundreds of different colors on a map?
Normally, I would not want to show more than 20 or so unique colors on a map because they would become indistinguishable. However, with some data, matching the color from the map to the legend is not the objective. The user just needs to see the outliers.
For example, a user may be looking at land rates for a given market area which may have a few hundred different values. Rendering unique value - even if there are hundreds - will enable the user to see, for example, the parcels where the land rate is inconsistent with the surrounding others.
Take a look at this website: http://afriggeri.github.com/RYB/. I can generate quite a few colors and they are about as distinguishable as can be done. Being able to render with a color generator such as this would work.
Thanks for taking time to help.
-Dan
12-10-2012
10:22 AM
- Mark as New
- Bookmark
- Subscribe
- Mute
- Subscribe to RSS Feed
- Permalink
but use a UniqueValueDefinition instead
I tried that, but couldn't quite get it to work.
Any suggestions?
12-10-2012
10:52 AM
- Mark as New
- Bookmark
- Subscribe
- Mute
- Subscribe to RSS Feed
- Permalink
John G from ESRI support provided the following, which is quite similar to what Derek Swingley suggested previously:
var generateRenderer = new esri.tasks.GenerateRendererTask(URL);
var params = new esri.tasks.GenerateRendererParameters();
var uniqueValueDef = new esri.tasks.UniqueValueDefinition();
uniqueValueDef.attributeField = "FieldName";
var colorRamp = new esri.tasks.AlgorithmicColorRamp();
colorRamp.fromColor = dojo.colorFromHex("#998ec3");
colorRamp.toColor = dojo.colorFromHex("#f1a340");
colorRamp.algorithm = "hsv";
uniqueValueDef.colorRamp = colorRamp;
params.classificationDefinition = uniqueValueDef;
params.where = layerDef;
generateRenderer.execute(params, applyRenderer, errorHandler);
The colors are not as distinguishable as I need them to be - but this is a good step in the right direction (Thanks John and Derek).
Sample results below (click image to see full size):
[ATTACH=CONFIG]19836[/ATTACH]
I'll mess with it a bit more and see if I can generate colors similar to the example here: http://afriggeri.github.com/RYB/