- Home
- :
- All Communities
- :
- Developers
- :
- JavaScript Maps SDK
- :
- JavaScript Maps SDK Questions
- :
- Re: How to dynamically chart data?
- Subscribe to RSS Feed
- Mark Topic as New
- Mark Topic as Read
- Float this Topic for Current User
- Bookmark
- Subscribe
- Mute
- Printer Friendly Page
- Mark as New
- Bookmark
- Subscribe
- Mute
- Subscribe to RSS Feed
- Permalink
Good day everybody,
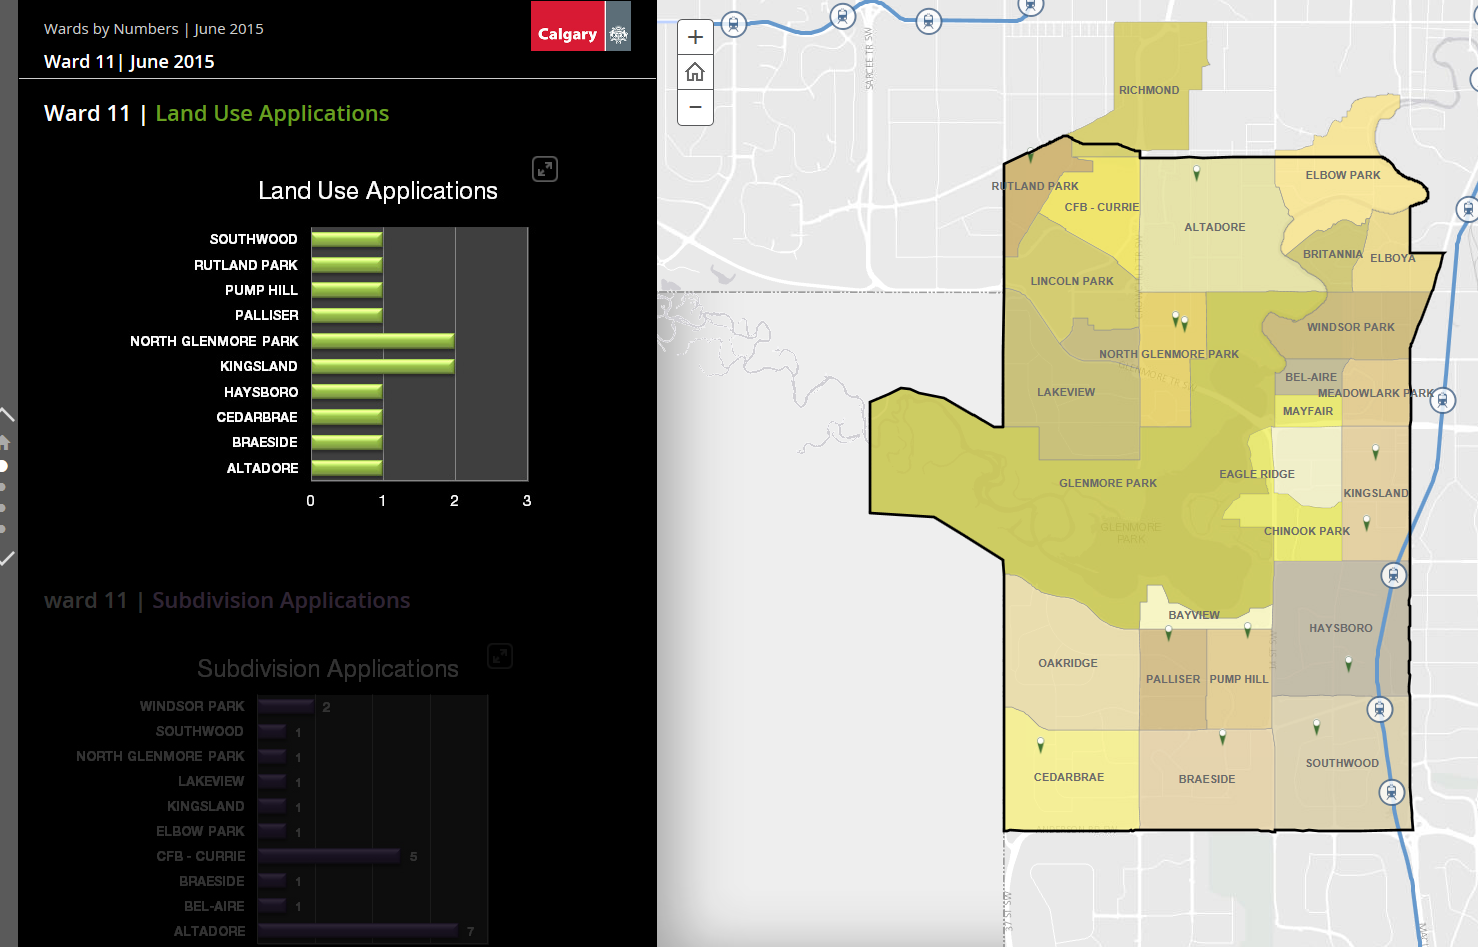
We have the following map which was created in AGOL using the "Story Map Journal" template. As you scroll through the chart data on the left, the data on the map changes to reflect the chart that is displayed. This works fine but is very manually intensive. There are approximately 90 charts which are all image files that are manually created and linked to, to display in the app.
I am wondering if it is possible to have the charts created on the fly in the same way that the map display changes dynamically. Not sure if this is the proper forum for this question but thought I'd start here.
Appreciate any ideas.
Thanks!
Solved! Go to Solution.
Accepted Solutions
- Mark as New
- Bookmark
- Subscribe
- Mute
- Subscribe to RSS Feed
- Permalink
Hi Chris,
I have created the following Census Data
If you click on a state it creates pie charts. Do you mean that?
Tim
- Mark as New
- Bookmark
- Subscribe
- Mute
- Subscribe to RSS Feed
- Permalink
Hi Chris,
I have created the following Census Data
If you click on a state it creates pie charts. Do you mean that?
Tim
- Mark as New
- Bookmark
- Subscribe
- Mute
- Subscribe to RSS Feed
- Permalink
Hi Tim,
I just checked your map out and I really like it. I’m going to show this to my colleagues and see what they think about this approach.
Are you able to pull data from a web service for this so that it’s live? I’m sure I’ll be back with other questions.
Thank you very much,
Chris
- Mark as New
- Bookmark
- Subscribe
- Mute
- Subscribe to RSS Feed
- Permalink
Hey Chris,
I'm glad you like it. It pulls the data out of the feature layer you click on (REST endpoint). So whenever you make changes to the published feature layer it will pull the new data.
Tim
- Mark as New
- Bookmark
- Subscribe
- Mute
- Subscribe to RSS Feed
- Permalink
Congratulations Tim, I see you got third place with this app!
I'm going to try to see if I can take a similar approach with redesigning our Ward Maps report. I'm sure I will be getting back to you with more questions down the road. Hope you don't mind.
Thanks and have a good day.
Chris
- Mark as New
- Bookmark
- Subscribe
- Mute
- Subscribe to RSS Feed
- Permalink
Thanks Chris, it was very exciting 
Summit County used my code to create the following County of Summit: Census Viewer maybe there is some information you could use.
Feel free to ask questions, I don't mind!
- Mark as New
- Bookmark
- Subscribe
- Mute
- Subscribe to RSS Feed
- Permalink
Great, thanks for sharing that link Tim. Just taking a scroll through your source file.
Cheers,
Chris