- Home
- :
- All Communities
- :
- Developers
- :
- JavaScript Maps SDK
- :
- JavaScript Maps SDK Questions
- :
- Re: Hide edit text symbol editor
- Subscribe to RSS Feed
- Mark Topic as New
- Mark Topic as Read
- Float this Topic for Current User
- Bookmark
- Subscribe
- Mute
- Printer Friendly Page
- Mark as New
- Bookmark
- Subscribe
- Mute
- Subscribe to RSS Feed
- Permalink
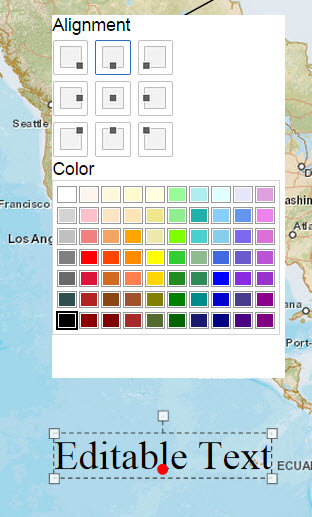
Is it possible to hide the pop-up dialog that appears when editToolbar.activate(Edit.EDIT_TEXT...) is activated?
Solved! Go to Solution.
Accepted Solutions
- Mark as New
- Bookmark
- Subscribe
- Mute
- Subscribe to RSS Feed
- Permalink
Hi Vygintas,
There is a property "textSymbolEditorHolder", which can be set in "options" list of parameters in the constructor of Edit Tool bar.
1. Include one div element in your html and set display as none for style, as below.
<div id="txtSymbolEditorHolder" style="display: none;"></div>
2. Then, specify the id of this div element as value for the property "textSymbolEditorHolder", as below
var options = {
allowAddVertices: registry.byId("vtx_ca").checked,
allowDeleteVertices: registry.byId("vtx_cd").checked,
uniformScaling: registry.byId("uniform_scaling").checked,
textSymbolEditorHolder: "txtSymbolEditorHolder"
};
Then, the symbol editor will not be displayed. below is the updated code of the sampe you mentioned which does not display the symbol editor.
======================================================================================
<!DOCTYPE html>
<html>
<head>
<meta http-equiv="Content-Type" content="text/html; charset=utf-8">
<!--The viewport meta tag is used to improve the presentation and behavior of the samples
on iOS devices-->
<meta name="viewport" content="initial-scale=1, maximum-scale=1,user-scalable=no">
<title>
Edit Tools
</title>
<link rel="stylesheet" href="http://js.arcgis.com/3.11/dijit/themes/nihilo/nihilo.css">
<link rel="stylesheet" href="http://js.arcgis.com/3.11/esri/css/esri.css">
<style>
html, body, #mainWindow {
font-family: sans-serif;
height: 100%;
width: 100%;
}
html, body {
margin: 0;
padding: 0;
}
#mainWindow {
visibility: hidden;
}
</style>
<script src="http://js.arcgis.com/3.11/"></script>
<script>
var map, editToolbar;
require([
"esri/map",
"esri/toolbars/edit",
"esri/graphic",
"esri/geometry/Point",
"esri/geometry/Polyline",
"esri/geometry/Polygon",
"esri/symbols/SimpleLineSymbol",
"esri/symbols/SimpleFillSymbol",
"esri/symbols/TextSymbol",
"dojo/_base/event",
"dojo/parser",
"dojo/dom",
"dojo/dom-style",
"dijit/registry",
"dijit/Menu",
"dijit/form/ToggleButton",
"dijit/form/DropDownButton",
"dijit/CheckedMenuItem",
"dijit/layout/BorderContainer",
"dijit/layout/ContentPane",
"dojo/domReady!"
], function (
Map, Edit, Graphic,
Point, Polyline, Polygon,
SimpleLineSymbol, SimpleFillSymbol, TextSymbol,
event, parser, dom, domStyle, registry, Menu
) {
parser.parse();
domStyle.set(registry.byId("mainWindow").domNode, "visibility", "visible");
map = new Map("map", {
basemap: "streets",
center: [3.955, 59.338],
zoom: 3
});
map.on("load", createToolbar);
function createToolbar() {
addGraphics();
editToolbar = new Edit(map);
//Activate the toolbar when you click on a graphic
map.graphics.on("click", function (evt) {
event.stop(evt);
activateToolbar(evt.graphic);
});
//deactivate the toolbar when you click outside a graphic
map.on("click", function (evt) {
editToolbar.deactivate();
});
}
function addGraphics() {
//add pre-defined geometries to map
var polygonSymbol = new SimpleFillSymbol();
var polylineSymbol = new SimpleLineSymbol();
var text = new TextSymbol("Editable Text");
text.font.setSize("20pt");
var polyline = new Polyline({
"paths": [
[
[-12484306, 7244028],
[-7318386, 10061803],
[-3013453, 10727111]
]
], "spatialReference": {
"wkid": 102100
}
});
var polygon = new Polygon({
"rings": [
[
[-4226661, 8496372],
[-3835304, 8731187],
[-2269873, 9005137],
[-1213208, 8613780],
[-1017529, 8065879],
[-1213208, 7478843],
[-2230738, 6891806],
[-2935181, 6735263],
[-3522218, 6891806],
[-3952711, 7165757],
[-4265797, 7283164],
[-4304933, 7635386],
[-4304933, 7674521],
[-4226661, 8496372]
]
],
"spatialReference": {
"wkid": 102100
}
});
var arrow = new Polygon({
"rings": [
[
[9862211, 6617856],
[8922952, 5522055],
[8922952, 5991684],
[6105178, 5991684],
[6105178, 7087485],
[8922952, 7087485],
[8922952, 7557114],
[9862211, 6617856]
]
],
"spatialReference": {
"wkid": 102100
}
});
var triangle = new Polygon({
"rings": [
[
[2426417, 8535508],
[4304933, 12292541],
[6183449, 8535508],
[2426417, 8535508]
]
],
"spatialReference": {
"wkid": 102100
}
});
var point = new Point(-40, 35);
map.graphics.add(new Graphic(polyline, polylineSymbol));
map.graphics.add(new Graphic(polygon, polygonSymbol));
map.graphics.add(new Graphic(arrow, polygonSymbol));
map.graphics.add(new Graphic(triangle, polygonSymbol));
map.graphics.add(new Graphic(point, text));
}
function activateToolbar(graphic) {
var tool = 0;
if (registry.byId("tool_move").checked) {
tool = tool | Edit.MOVE;
}
if (registry.byId("tool_vertices").checked) {
tool = tool | Edit.EDIT_VERTICES;
}
if (registry.byId("tool_scale").checked) {
tool = tool | Edit.SCALE;
}
if (registry.byId("tool_rotate").checked) {
tool = tool | Edit.ROTATE;
}
// enable text editing if a graphic uses a text symbol
if (graphic.symbol.declaredClass === "esri.symbol.TextSymbol") {
tool = tool | Edit.EDIT_TEXT;
}
//specify toolbar options
var options = {
allowAddVertices: registry.byId("vtx_ca").checked,
allowDeleteVertices: registry.byId("vtx_cd").checked,
uniformScaling: registry.byId("uniform_scaling").checked,
textSymbolEditorHolder: "txtSymbolEditorHolder"
};
editToolbar.activate(tool, graphic, options);
}
});
</script>
</head>
<body class="nihilo">
<div id="mainWindow" data-dojo-type="dijit/layout/BorderContainer" data-dojo-props="design:'headline', gutters:'false'">
<div id="header" data-dojo-type="dijit/layout/ContentPane" data-dojo-props="region:'top'" style="height:58px;text-align:left;font-weight:bold;font-size:14px;color:#400D12;">
<span>Specify options then click a graphic to edit the shape. Click outside the graphic to deactivate the toolbar.</span><br />
<div id="tool_move" data-dojo-type="dijit/form/ToggleButton" data-dojo-props="checked:'true', iconClass:'dijitCheckBoxIcon'">Move</div>
<div id="tool_vertices" data-dojo-type="dijit/form/ToggleButton" data-dojo-props="checked:'true', iconClass:'dijitCheckBoxIcon'">Edit Vertices</div>
<div id="tool_scale" data-dojo-type="dijit/form/ToggleButton" data-dojo-props="checked:'true', iconClass:'dijitCheckBoxIcon'">Scale</div>
<div id="tool_rotate" data-dojo-type="dijit/form/ToggleButton" data-dojo-props="checked:'true', iconClass:'dijitCheckBoxIcon'">Rotate</div>
<button data-dojo-type="dijit/form/DropDownButton" id="options" data-dojo-props="value:'options'">
<span>Options</span>
<div data-dojo-type="dijit/Menu" id="optionsMenu">
<div id="vtx_ca" data-dojo-type="dijit/CheckedMenuItem" data-dojo-props="checked:'true'">Allow Add Vertices</div>
<div id="vtx_cd" data-dojo-type="dijit/CheckedMenuItem" data-dojo-props="checked:'true'">Allow Delete Vertices</div>
<div id="uniform_scaling" data-dojo-type="dijit/CheckedMenuItem" data-dojo-props="checked:'true'">Uniform Scaling when Resizing</div>
</div>
</button>
</div>
<div id="map" data-dojo-type="dijit/layout/ContentPane" data-dojo-props="region:'center'">
<div id="txtSymbolEditorHolder" style="display: none;"></div>
</div>
</div>
</body>
</html>
========================================================================================
Please let me know if it helped.
Thanks & Regards,
Vara Prasad.
- Mark as New
- Bookmark
- Subscribe
- Mute
- Subscribe to RSS Feed
- Permalink
Hi Vygintas,
Is it possible for you to provide any sample application?
Thanks & Regards,
Vara Prasad.
- Mark as New
- Bookmark
- Subscribe
- Mute
- Subscribe to RSS Feed
- Permalink
Hi Vara,
This sample has the above mentioned functionality https://developers.arcgis.com/javascript/jssamples/toolbar_edit.html
- Mark as New
- Bookmark
- Subscribe
- Mute
- Subscribe to RSS Feed
- Permalink
Hi Vygintas,
There is a property "textSymbolEditorHolder", which can be set in "options" list of parameters in the constructor of Edit Tool bar.
1. Include one div element in your html and set display as none for style, as below.
<div id="txtSymbolEditorHolder" style="display: none;"></div>
2. Then, specify the id of this div element as value for the property "textSymbolEditorHolder", as below
var options = {
allowAddVertices: registry.byId("vtx_ca").checked,
allowDeleteVertices: registry.byId("vtx_cd").checked,
uniformScaling: registry.byId("uniform_scaling").checked,
textSymbolEditorHolder: "txtSymbolEditorHolder"
};
Then, the symbol editor will not be displayed. below is the updated code of the sampe you mentioned which does not display the symbol editor.
======================================================================================
<!DOCTYPE html>
<html>
<head>
<meta http-equiv="Content-Type" content="text/html; charset=utf-8">
<!--The viewport meta tag is used to improve the presentation and behavior of the samples
on iOS devices-->
<meta name="viewport" content="initial-scale=1, maximum-scale=1,user-scalable=no">
<title>
Edit Tools
</title>
<link rel="stylesheet" href="http://js.arcgis.com/3.11/dijit/themes/nihilo/nihilo.css">
<link rel="stylesheet" href="http://js.arcgis.com/3.11/esri/css/esri.css">
<style>
html, body, #mainWindow {
font-family: sans-serif;
height: 100%;
width: 100%;
}
html, body {
margin: 0;
padding: 0;
}
#mainWindow {
visibility: hidden;
}
</style>
<script src="http://js.arcgis.com/3.11/"></script>
<script>
var map, editToolbar;
require([
"esri/map",
"esri/toolbars/edit",
"esri/graphic",
"esri/geometry/Point",
"esri/geometry/Polyline",
"esri/geometry/Polygon",
"esri/symbols/SimpleLineSymbol",
"esri/symbols/SimpleFillSymbol",
"esri/symbols/TextSymbol",
"dojo/_base/event",
"dojo/parser",
"dojo/dom",
"dojo/dom-style",
"dijit/registry",
"dijit/Menu",
"dijit/form/ToggleButton",
"dijit/form/DropDownButton",
"dijit/CheckedMenuItem",
"dijit/layout/BorderContainer",
"dijit/layout/ContentPane",
"dojo/domReady!"
], function (
Map, Edit, Graphic,
Point, Polyline, Polygon,
SimpleLineSymbol, SimpleFillSymbol, TextSymbol,
event, parser, dom, domStyle, registry, Menu
) {
parser.parse();
domStyle.set(registry.byId("mainWindow").domNode, "visibility", "visible");
map = new Map("map", {
basemap: "streets",
center: [3.955, 59.338],
zoom: 3
});
map.on("load", createToolbar);
function createToolbar() {
addGraphics();
editToolbar = new Edit(map);
//Activate the toolbar when you click on a graphic
map.graphics.on("click", function (evt) {
event.stop(evt);
activateToolbar(evt.graphic);
});
//deactivate the toolbar when you click outside a graphic
map.on("click", function (evt) {
editToolbar.deactivate();
});
}
function addGraphics() {
//add pre-defined geometries to map
var polygonSymbol = new SimpleFillSymbol();
var polylineSymbol = new SimpleLineSymbol();
var text = new TextSymbol("Editable Text");
text.font.setSize("20pt");
var polyline = new Polyline({
"paths": [
[
[-12484306, 7244028],
[-7318386, 10061803],
[-3013453, 10727111]
]
], "spatialReference": {
"wkid": 102100
}
});
var polygon = new Polygon({
"rings": [
[
[-4226661, 8496372],
[-3835304, 8731187],
[-2269873, 9005137],
[-1213208, 8613780],
[-1017529, 8065879],
[-1213208, 7478843],
[-2230738, 6891806],
[-2935181, 6735263],
[-3522218, 6891806],
[-3952711, 7165757],
[-4265797, 7283164],
[-4304933, 7635386],
[-4304933, 7674521],
[-4226661, 8496372]
]
],
"spatialReference": {
"wkid": 102100
}
});
var arrow = new Polygon({
"rings": [
[
[9862211, 6617856],
[8922952, 5522055],
[8922952, 5991684],
[6105178, 5991684],
[6105178, 7087485],
[8922952, 7087485],
[8922952, 7557114],
[9862211, 6617856]
]
],
"spatialReference": {
"wkid": 102100
}
});
var triangle = new Polygon({
"rings": [
[
[2426417, 8535508],
[4304933, 12292541],
[6183449, 8535508],
[2426417, 8535508]
]
],
"spatialReference": {
"wkid": 102100
}
});
var point = new Point(-40, 35);
map.graphics.add(new Graphic(polyline, polylineSymbol));
map.graphics.add(new Graphic(polygon, polygonSymbol));
map.graphics.add(new Graphic(arrow, polygonSymbol));
map.graphics.add(new Graphic(triangle, polygonSymbol));
map.graphics.add(new Graphic(point, text));
}
function activateToolbar(graphic) {
var tool = 0;
if (registry.byId("tool_move").checked) {
tool = tool | Edit.MOVE;
}
if (registry.byId("tool_vertices").checked) {
tool = tool | Edit.EDIT_VERTICES;
}
if (registry.byId("tool_scale").checked) {
tool = tool | Edit.SCALE;
}
if (registry.byId("tool_rotate").checked) {
tool = tool | Edit.ROTATE;
}
// enable text editing if a graphic uses a text symbol
if (graphic.symbol.declaredClass === "esri.symbol.TextSymbol") {
tool = tool | Edit.EDIT_TEXT;
}
//specify toolbar options
var options = {
allowAddVertices: registry.byId("vtx_ca").checked,
allowDeleteVertices: registry.byId("vtx_cd").checked,
uniformScaling: registry.byId("uniform_scaling").checked,
textSymbolEditorHolder: "txtSymbolEditorHolder"
};
editToolbar.activate(tool, graphic, options);
}
});
</script>
</head>
<body class="nihilo">
<div id="mainWindow" data-dojo-type="dijit/layout/BorderContainer" data-dojo-props="design:'headline', gutters:'false'">
<div id="header" data-dojo-type="dijit/layout/ContentPane" data-dojo-props="region:'top'" style="height:58px;text-align:left;font-weight:bold;font-size:14px;color:#400D12;">
<span>Specify options then click a graphic to edit the shape. Click outside the graphic to deactivate the toolbar.</span><br />
<div id="tool_move" data-dojo-type="dijit/form/ToggleButton" data-dojo-props="checked:'true', iconClass:'dijitCheckBoxIcon'">Move</div>
<div id="tool_vertices" data-dojo-type="dijit/form/ToggleButton" data-dojo-props="checked:'true', iconClass:'dijitCheckBoxIcon'">Edit Vertices</div>
<div id="tool_scale" data-dojo-type="dijit/form/ToggleButton" data-dojo-props="checked:'true', iconClass:'dijitCheckBoxIcon'">Scale</div>
<div id="tool_rotate" data-dojo-type="dijit/form/ToggleButton" data-dojo-props="checked:'true', iconClass:'dijitCheckBoxIcon'">Rotate</div>
<button data-dojo-type="dijit/form/DropDownButton" id="options" data-dojo-props="value:'options'">
<span>Options</span>
<div data-dojo-type="dijit/Menu" id="optionsMenu">
<div id="vtx_ca" data-dojo-type="dijit/CheckedMenuItem" data-dojo-props="checked:'true'">Allow Add Vertices</div>
<div id="vtx_cd" data-dojo-type="dijit/CheckedMenuItem" data-dojo-props="checked:'true'">Allow Delete Vertices</div>
<div id="uniform_scaling" data-dojo-type="dijit/CheckedMenuItem" data-dojo-props="checked:'true'">Uniform Scaling when Resizing</div>
</div>
</button>
</div>
<div id="map" data-dojo-type="dijit/layout/ContentPane" data-dojo-props="region:'center'">
<div id="txtSymbolEditorHolder" style="display: none;"></div>
</div>
</div>
</body>
</html>
========================================================================================
Please let me know if it helped.
Thanks & Regards,
Vara Prasad.