Turn on suggestions
Auto-suggest helps you quickly narrow down your search results by suggesting possible matches as you type.
Cancel
- Home
- :
- All Communities
- :
- Developers
- :
- JavaScript Maps SDK
- :
- JavaScript Maps SDK Questions
- :
- Re: Heatmaps
Options
- Subscribe to RSS Feed
- Mark Topic as New
- Mark Topic as Read
- Float this Topic for Current User
- Bookmark
- Subscribe
- Mute
- Printer Friendly Page
Heatmaps
Subscribe
6169
13
06-25-2010 06:16 AM
06-25-2010
06:16 AM
- Mark as New
- Bookmark
- Subscribe
- Mute
- Subscribe to RSS Feed
- Permalink
I want to creat a heatmap. I seems that the examples points to using heatmapapi.com but it is unavailable and it seems that has been unavailable for a while.
What is the recommended way or library to use to create heatmaps. It seems that the silverlight library has it.
What is the recommended way or library to use to create heatmaps. It seems that the silverlight library has it.
13 Replies
06-25-2010
08:50 AM
- Mark as New
- Bookmark
- Subscribe
- Mute
- Subscribe to RSS Feed
- Permalink
Well, using server side calculation, you can just wrap the kernel density tool in a tool service in order to do heat map.
What the silverlight example does, though, is execute kernel density server side and produce output using a png encoder. The intensity slider corresponds to the kernel bandwidth.
I've always been opposed to the concept behind the heatmap api though, because kernel density requires a lot of consideration of the bandwidth and the kernel shape in order to be used appropriately. A Gaussian kernel is not always the right way to go; a fixed kernel is not always best. The bandwidth requires a lot of examination of the dataset to get correct, and a variable bandwidth may or may not be appropriate.
Pushing all of this down into a single set of variables, or even into user side settings when the user does not have a spatial analysis background, is going to put out bad results more often than useful results.
So, it might be better to use server side python scripts to produce the output you want with appropriate decisions in place on the kernel density output (even if esri only has a Gaussian kernel density tool right now - more versions are coming at 10). Push that output to a map service and server that out instead.
07-06-2010
07:04 AM
- Mark as New
- Bookmark
- Subscribe
- Mute
- Subscribe to RSS Feed
- Permalink
Yepp, I've done it with the Kernel Density tool in a Geoprocessing layer in the MXD. The output is the raster of the tool. The task is done asynchronously.
07-16-2010
05:00 AM
- Mark as New
- Bookmark
- Subscribe
- Mute
- Subscribe to RSS Feed
- Permalink
Great Thanks, I will have to talk to my GIS group.
On the mean time I found in one of the sample projects a library called hclayer.swc with packages like com.esri.ps.atl.rr.heatmap. I plugged it in and it did the trick (for what I needed it right now, and I totally understand and agree on lordcabs comments).
I can not find any documentation or mention to this library anywhere.
Seems to be an esri library by the packages names that contains. Can anybody point me or give me information about this libarary.
04-15-2011
09:33 AM
- Mark as New
- Bookmark
- Subscribe
- Mute
- Subscribe to RSS Feed
- Permalink
Hi Jorge,
Were you able to implement a heatmap using the javascript api and the com.esri.ps.atl.rr.heatmap library? I'm interested in learning how to do this with the Google Extension API without resorting to the heatmapapi.com approach. Any insight as to how you implemented your solution would be greatly appreciated. Thanks Jorge!
Were you able to implement a heatmap using the javascript api and the com.esri.ps.atl.rr.heatmap library? I'm interested in learning how to do this with the Google Extension API without resorting to the heatmapapi.com approach. Any insight as to how you implemented your solution would be greatly appreciated. Thanks Jorge!
07-12-2011
09:13 AM
- Mark as New
- Bookmark
- Subscribe
- Mute
- Subscribe to RSS Feed
- Permalink
Great Thanks, I will have to talk to my GIS group.
On the mean time I found in one of the sample projects a library called hclayer.swc with packages like com.esri.ps.atl.rr.heatmap. I plugged it in and it did the trick (for what I needed it right now, and I totally understand and agree on lordcabs comments).
I can not find any documentation or mention to this library anywhere.
Seems to be an esri library by the packages names that contains. Can anybody point me or give me information about this libarary.
Hi Jorge , this libraryhclayer.swc is for flex api or javascript api ?. I also need to implement heat maps through arcgis javascript interface .
heatmapapi is not feasible as it only allows 100 points to used for its free version.also i need support for IE 6 , 7, 8 therefore cannot use javascript lib which utilize HTML5 elements.
I am also trying to use kernal density tool to publish the map as Geoprocessing service . I have point data and all the points have equal weights. Need to create heat map based upon the concentration.
08-17-2011
11:33 AM
- Mark as New
- Bookmark
- Subscribe
- Mute
- Subscribe to RSS Feed
- Permalink
I am writing a script in python that uses the Kernel Density tool.
I am having problems specifying the output raster. In the tool from the toolbox there is a field to specify the output location (which the default is giving me an error), but when using the python window it doesnt give me a space to designate the output location.
The syntax from the esri website is
KernelDensity (in_features, population_field, {cell_size}, {search_radius}, {area_unit_scale_factor})
Is there anyway to give it an output location other than the default?
Any help would be much appreciated.
Cheers,
Cody
01-06-2012
07:01 AM
- Mark as New
- Bookmark
- Subscribe
- Mute
- Subscribe to RSS Feed
- Permalink
Did you ever figure this out? I am having the same issue.
I am writing a script in python that uses the Kernel Density tool.
I am having problems specifying the output raster. In the tool from the toolbox there is a field to specify the output location (which the default is giving me an error), but when using the python window it doesnt give me a space to designate the output location.
The syntax from the esri website is
KernelDensity (in_features, population_field, {cell_size}, {search_radius}, {area_unit_scale_factor})
Is there anyway to give it an output location other than the default?
Any help would be much appreciated.
Cheers,
Cody
01-06-2012
05:51 PM
- Mark as New
- Bookmark
- Subscribe
- Mute
- Subscribe to RSS Feed
- Permalink
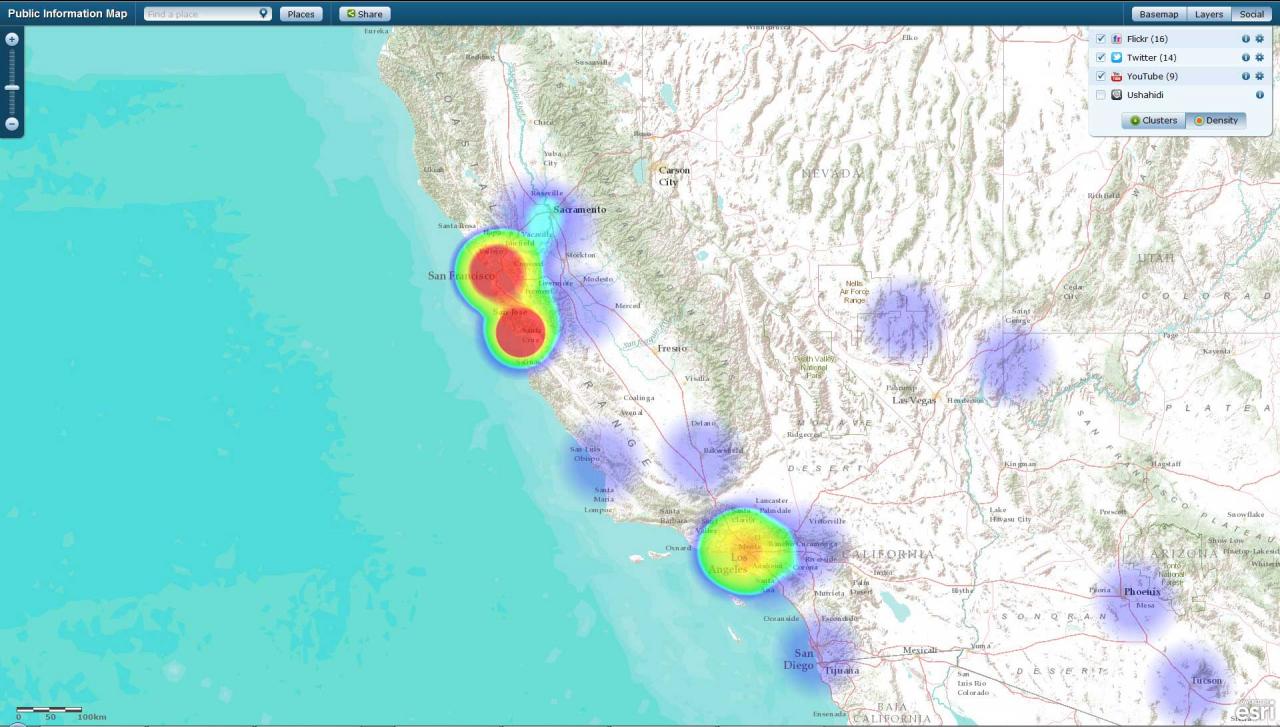
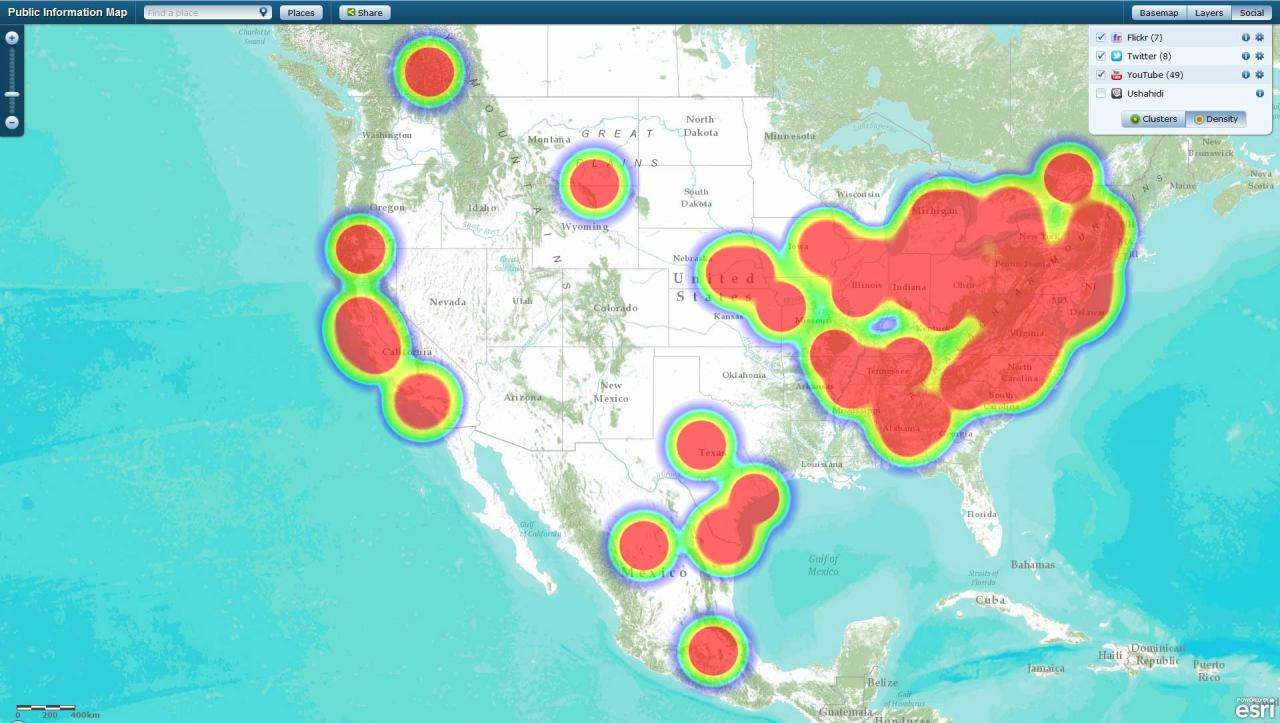
We're implementing heatmapping for an update to the Public Information Map template using Heatmap.js
Screens attached on how it looks.
Here's the link. Let me know if you need the source code.
http://www.patrick-wied.at/static/heatmapjs/
Screens attached on how it looks.
Here's the link. Let me know if you need the source code.
http://www.patrick-wied.at/static/heatmapjs/
01-08-2012
02:59 PM
- Mark as New
- Bookmark
- Subscribe
- Mute
- Subscribe to RSS Feed
- Permalink
Hi Matt,
I'd like the source code please. Stephen dot Lead at Gmail dot com.
Cheers,
Steve
Let me know if you need the source code.
I'd like the source code please. Stephen dot Lead at Gmail dot com.
Cheers,
Steve