Turn on suggestions
Auto-suggest helps you quickly narrow down your search results by suggesting possible matches as you type.
Cancel
- Home
- :
- All Communities
- :
- Developers
- :
- JavaScript Maps SDK
- :
- JavaScript Maps SDK Questions
- :
- Get the field "value" from mediaInfos to work in p...
Options
- Subscribe to RSS Feed
- Mark Topic as New
- Mark Topic as Read
- Float this Topic for Current User
- Bookmark
- Subscribe
- Mute
- Printer Friendly Page
Get the field "value" from mediaInfos to work in popup ArcGIS API JS
Subscribe
884
0
10-23-2020 09:12 AM
10-23-2020
09:12 AM
- Mark as New
- Bookmark
- Subscribe
- Mute
- Subscribe to RSS Feed
- Permalink
Hello,
I am trying to use the LineChartMediaInfo element in order to plot a simple array of points in the popup content.
However, I dont really know how to make it work. Can the fields of the values contain arrays?
Here is part of my code with a test array "array1" containing 4 numbers.
var pointGraphic = new Graphic({
geometry: point,
symbol: simpleMarkerSymbol,
popupTemplate: popupTemplate,
attributes: {
array1: [1, 2, 3, 4],
longitude: metadata["longitude"],
latitude: metadata["latitude"]
}
});
var popupTemplate = {
title: metadata["officialName"],
content: [
{
// Pass in the fields to display
type: "media",
mediaInfos: [{
title: "<b>Prédiction</b>",
type: "line-chart",
value: {
fields: ["array1"],
normalizeField: null
}
} ]
}]
};
I cant figure out from the doc (LineChartMediaInfo | ArcGIS API for JavaScript 4.17 )why it give me something like that:
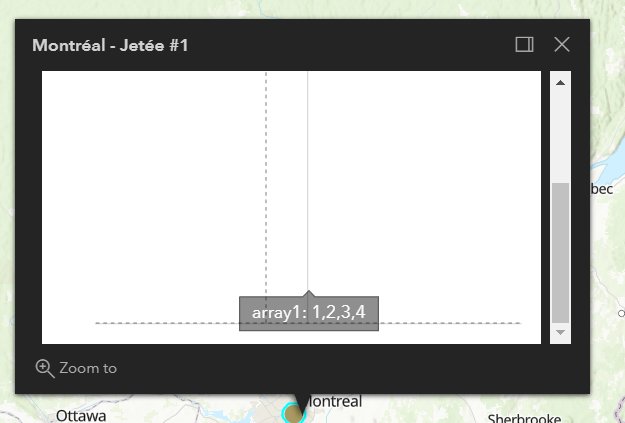
Thanks a lot for your help!
Julien
0 Replies