- Home
- :
- All Communities
- :
- Developers
- :
- JavaScript Maps SDK
- :
- JavaScript Maps SDK Questions
- :
- Generate polygon ring from user input coordinates
- Subscribe to RSS Feed
- Mark Topic as New
- Mark Topic as Read
- Float this Topic for Current User
- Bookmark
- Subscribe
- Mute
- Printer Friendly Page
Generate polygon ring from user input coordinates
- Mark as New
- Bookmark
- Subscribe
- Mute
- Subscribe to RSS Feed
- Permalink
Hello,
I want to develop a small application that get coordinates from user as input and generate a list of it. then i want to show this as a polygon on the map.
I am unable to push the list to the polygon ring. Anybody can help please
I application is attached!
Solved! Go to Solution.
Accepted Solutions
- Mark as New
- Bookmark
- Subscribe
- Mute
- Subscribe to RSS Feed
- Permalink
You can try this one..
but its need to be more specific
- Mark as New
- Bookmark
- Subscribe
- Mute
- Subscribe to RSS Feed
- Permalink
Dear Avinash,
I cannot reach to source of your sample, can you share!
- Mark as New
- Bookmark
- Subscribe
- Mute
- Subscribe to RSS Feed
- Permalink
- Mark as New
- Bookmark
- Subscribe
- Mute
- Subscribe to RSS Feed
- Permalink
Thank you Avinash, Robert did it for me...
- Mark as New
- Bookmark
- Subscribe
- Mute
- Subscribe to RSS Feed
- Permalink
Robert,
Thank you very much for your time. This was exactly what i need.. Thanks again!
- Mark as New
- Bookmark
- Subscribe
- Mute
- Subscribe to RSS Feed
- Permalink
Dear Robert,
What if i want to use UTM projected coordinates to place graphics. I tried to change the spatialReference to { wkid: 32638 }. But it is not working..
It might be easy but i am new to custom development.. Any help!
- Mark as New
- Bookmark
- Subscribe
- Mute
- Subscribe to RSS Feed
- Permalink
Muhammed,
It would look like this then:
<!DOCTYPE html>
<html>
<head>
<meta charset="utf-8">
<meta name="viewport" content="initial-scale=1, maximum-scale=1, user-scalable=no">
<title>Coordinate to Map</title>
<style>
html,
body,
#viewDiv {
padding: 0;
margin: 0;
height: 100%;
width: 100%;
}
</style>
<link rel="stylesheet" href="https://maxcdn.bootstrapcdn.com/bootstrap/3.3.6/css/bootstrap.min.css" />
<script src="https://ajax.googleapis.com/ajax/libs/jquery/3.1.1/jquery.min.js"></script>
<link rel="stylesheet" href="https://js.arcgis.com/4.1/esri/css/main.css">
<script src="https://js.arcgis.com/4.1/"></script>
<script src="https://ajax.googleapis.com/ajax/libs/jquery/1.12.4/jquery.min.js"></script>
<!--########## Map ###########-->
<script>
var app = {};
require([
"esri/Map",
"esri/views/SceneView",
"esri/widgets/Popup",
"esri/geometry/Polygon",
"esri/symbols/SimpleFillSymbol",
"esri/tasks/GeometryService",
"esri/tasks/support/ProjectParameters",
"esri/config",
"esri/Graphic", "dojo/dom", "dojo/on", "dojo/domReady!"
], function(
Map, SceneView, Popup, Polygon,
SimpleFillSymbol,
GeometryService,
ProjectParameters,
esriConfig,
Graphic, dom, on
) {
var map = new Map({
basemap: "hybrid",
ground: "world-elevation"
});
var view = new SceneView({
center: [43.940626, 26.346404],
container: "viewDiv",
map: map,
zoom: 12,
tilt: 30
});
esriConfig.geometryServiceUrl = "https://utility.arcgisonline.com/ArcGIS/rest/services/Geometry/GeometryServer";
view.on("click", function(event) {
view.popup.location = event.mapPoint;
// Displays the popup
view.popup.visible = true;
});
var polAtt = {
Name: "Keystone Pipeline",
Owner: "TransCanada",
Length: "3,456 km"
};
/************************
* Create a polygon graphic
************************/
function showPolygon() {
// Create a polygon geometry
var polygon = new Polygon({
rings: [
[43.935018, 26.365905],
[43.958770, 26.366693],
[43.961578, 26.348339],
[43.933733, 26.342883]
]
});
console.info(polygon.toJSON());
// Create a symbol for rendering the graphic
var fillSymbol = new SimpleFillSymbol({
color: [227, 139, 79, 0.8],
outline: { // autocasts as new SimpleLineSymbol()
color: [255, 255, 255],
width: 1
}
});
/*******************************************
* Create a new graphic and add the geometry,
******************************************/
var polygonGraphic = new Graphic({
geometry: polygon,
symbol: fillSymbol,
attributes: polAtt,
popupTemplate: { // autocasts as new PopupTemplate()
title: "{Name}",
content: [{
type: "fields",
fieldInfos: [{
fieldName: "Name"
}, {
fieldName: "Owner"
}, {
fieldName: "Length"
}]
}]
}
});
view.graphics.addMany([polygonGraphic]);
view.goTo([polygonGraphic]);
}
app.addUserPolygon = function(json) {
console.info(json);
//return;
view.graphics.removeAll();
// Create a symbol for rendering the graphic
var fillSymbol = new SimpleFillSymbol({
color: [227, 139, 79, 0.8],
outline: { // autocasts as new SimpleLineSymbol()
color: [255, 255, 255],
width: 1
}
});
// create the polygon and project it to the maps SR
var poly = new Polygon({
rings: json,
spatialReference: { wkid: 32638 }
});
var params = new ProjectParameters({
geomerties: [poly],
outSR: map.spatialReference
});
var geomSer = new GeometryService(esriConfig.geometryServiceUrl);
geomSer.project(params).then(lang.hitch(this, function(geoms){
var polygonGraphic = new Graphic({
geometry: geoms[0],
symbol: fillSymbol,
attributes: polAtt,
popupTemplate: { // autocasts as new PopupTemplate()
title: "{Name}",
content: [{
type: "fields",
fieldInfos: [{
fieldName: "Name"
}, {
fieldName: "Owner"
}, {
fieldName: "Length"
}]
}]
}
});
view.graphics.addMany([polygonGraphic]);
view.goTo([polygonGraphic]);
}));
}
// Add the graphics to the view's graphics layer
on(dom.byId("showBtn"), "click", showPolygon);
});
</script>
</head>
<body>
<h1 id="heading">أحداثيات الى خريطة</h1>
<h4> Please Enter Geographic Coordinates Clockwise! </h4>
<input type="text" id="coord">
<input type='button' onclick="changeText2(); clearCoord();" value='Submit' />
<p>Coordinates List:</p>
<ol id="demo"></ol>
<button id="showBtn">Show Polygon on Map</button>
<div id="viewDiv"></div>
<script src="listCoord.js"></script>
</body>
</html>
- Mark as New
- Bookmark
- Subscribe
- Mute
- Subscribe to RSS Feed
- Permalink
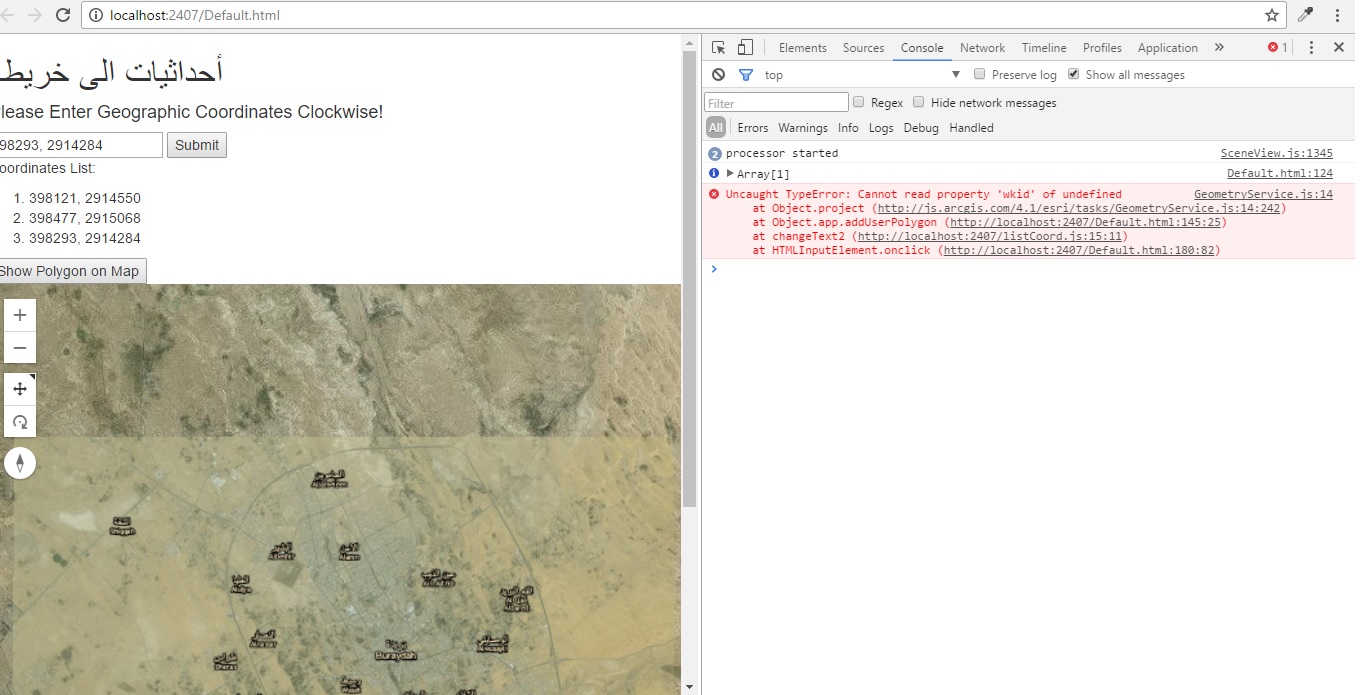
Dear Robert,
I tried it but got the error "Cannot read property 'wkid' of undefined".