- Home
- :
- All Communities
- :
- Developers
- :
- JavaScript Maps SDK
- :
- JavaScript Maps SDK Questions
- :
- Edit Tick Marks on Time Slider
- Subscribe to RSS Feed
- Mark Topic as New
- Mark Topic as Read
- Float this Topic for Current User
- Bookmark
- Subscribe
- Mute
- Printer Friendly Page
- Mark as New
- Bookmark
- Subscribe
- Mute
- Subscribe to RSS Feed
- Permalink
Hi all,
I was wondering how to just display the tick marks that correspond to the labels in the time slider?
For example, I want to put a tick mark every January of YYYY.
I'm getting a tick mark for every time interval which is every month from 1984 to 2013.

Thanks for all your help!
Francisco
Solved! Go to Solution.
Accepted Solutions
- Mark as New
- Bookmark
- Subscribe
- Mute
- Subscribe to RSS Feed
- Permalink
You can always just use a number too. 
timeSlider.setTickCount(30);
Regards,
Tom
- Mark as New
- Bookmark
- Subscribe
- Mute
- Subscribe to RSS Feed
- Permalink
Fransisco,
You can use the setTickCount method. Here is a link:
TimeSlider | API Reference | ArcGIS API for JavaScript
Regards,
Tom
- Mark as New
- Bookmark
- Subscribe
- Mute
- Subscribe to RSS Feed
- Permalink
Hi Tom,
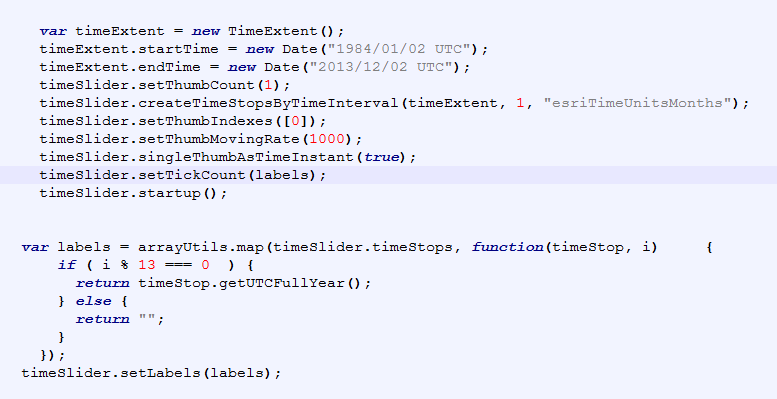
I've tried the following but I'm still getting some errors. It returns tick marks just on the first and last month of my dataset. Am I missing a parameter??
Labels is a global variable.

Thanks for all your help!
Francisco
- Mark as New
- Bookmark
- Subscribe
- Mute
- Subscribe to RSS Feed
- Permalink
Fransisco,
setTickCount is expecting a number. Since labels is an array, you could do:
timeSlider.setTickCount(labels.length);
Regards,
Tom
- Mark as New
- Bookmark
- Subscribe
- Mute
- Subscribe to RSS Feed
- Permalink
Thanks for all your help Tom! Unfortunately, I think some part of my labels is undefined as a console.log() is indicating.
Kindest Regards,
Francisco
- Mark as New
- Bookmark
- Subscribe
- Mute
- Subscribe to RSS Feed
- Permalink
You can always just use a number too.
timeSlider.setTickCount(30);
Regards,
Tom
- Mark as New
- Bookmark
- Subscribe
- Mute
- Subscribe to RSS Feed
- Permalink
Thanks Tom! This will work!
- Mark as New
- Bookmark
- Subscribe
- Mute
- Subscribe to RSS Feed
- Permalink
Glad that worked for you!
Regards,
Tom