- Home
- :
- All Communities
- :
- Developers
- :
- JavaScript Maps SDK
- :
- JavaScript Maps SDK Questions
- :
- Re: Converting Json Data to Feature Layer
- Subscribe to RSS Feed
- Mark Topic as New
- Mark Topic as Read
- Float this Topic for Current User
- Bookmark
- Subscribe
- Mute
- Printer Friendly Page
Converting Json Data to Feature Layer
- Mark as New
- Bookmark
- Subscribe
- Mute
- Subscribe to RSS Feed
- Permalink
Hello everyone!
I'm new to Javascript API, but its mostly straight forward with the documentation, however I'm having trouble converting JSON data to a Feature Layer. Now I referred to the reference documents but it seems like I'm missing something.
So the idea is we creating our own API on the web server, and fetching the data when needed (of course in JSON format), like this:
{ id: 1, Company Name: "1670143 Ontario Inc.",
# of Local Employees: 2.5,
Address: "204LebretonStreetNorth Ottawa,OntarioK1R7J1 Canada",
Business Description: "We bring the Internet of All Things to a meaningful conclusion...right in the palm of your hand.", Company Age: "years", Industry: "Software, Cloud and SaaS", Phone: "(613)878-1135"
},
{ id: 2, Company Name: "2CI Technologies Inc",
# of Local Employees: 2.5,
Address: "1678Canemorecrescent Ottawa,OntarioK4A1S8 Canada",
Business Description: "Health and wellness IT development",
Company Age: "20 years",
Industry: "IT Consultants and Software Services", Phone: "(613)834-8144"
},
...
now when im trying to convert the JSON Object with:
var flRenderer = rendererJsonUtils.fromJSON(json_object);
i get null
Did anybody stumbled upon this issue before?
P.S.
Im working version 4.4 of the API.
- Mark as New
- Bookmark
- Subscribe
- Mute
- Subscribe to RSS Feed
- Permalink
Hey Anton,
This is a pretty broad question. Firstly, to create a Feature Layer, you first need to create a list of Graphic Objects, which the Feature Layer expects, e.g.:
[{
geometry: new Point({ x: -100, y: 38 }),
attributes: { ObjectID: 1, DepArpt: "KATL", MsgTime: Date.now(), FltId: "UAL1" }
},
{
geometry: new Point({ x: -77, y: 35 }),
attributes: { ObjectID: 2, DepArpt: "KZBW", MsgTime: Date.now(), FltId: "SW999" }
}]
Each feature will need to be a Graphic object (the attributes above are just examples).
You can then use the Feature Layer's source property to set the layers graphics to the above list of features. See this part of the API docs: FeatureLayer | API Reference | ArcGIS API for JavaScript 4.
Or, if you have ArcGIS Server, or a Hosted Feature Layer in ArcGIS Online or Portal, you can point your Feature Layer directly to those services.
Secondly, the rendererJsonUtils is the wrong thing to be using here to convert your JSON into features. A Renderer in the JavaScript API, is used to define how features are visually represented, not the feature object itself.
To parse your JSON into features, especially through your own Web Server API, there are numerous ways to achieve this. You could use the Graphic fromJSON method on each feature and store the Graphic object in an array, then use that array as your source for the Feature Layer. Alternatively, you could get your Web Server API to return more specific formatting on your features and then use the FeatureSet fromJSON method, then use that as your source. However this case would require quite a bit more effort to return the appropriate JSON structure as specified by the ArcGIS REST API. Going down this path is essentially mimicking the behaviour of ArcGIS Server and Hosted Feature Layers.
Finally, depending on your use cases for a Feature Layer, it may be easier to start with a Graphics Layer to store your graphics. I would also suggest looking through the JavaScript API Samples, as there is a specific example, which is closely related to what you're trying to do: Create a FeatureLayer with client side graphics | ArcGIS API for JavaScript 4.4.
- Mark as New
- Bookmark
- Subscribe
- Mute
- Subscribe to RSS Feed
- Permalink
Hey Jordan,
Thank you for the detailed response, its starting to get clearer to me. I apologize in advance, because I'm still fairly new to this.
I took your advice, and I'm looping through each object in my returned response from my API, creating a Graphic from each Object in the returned response in the following manner:
data.forEach(function(element) {
var new_graphic = Graphic.fromJSON(element);
graphics_array.push(new_graphic);
}, this);however, when i console log graphics_array, i see this:

across all the graphic object saved in graphics_array .
Now the objects I was looping through weren't empty, they all shared the following structure:
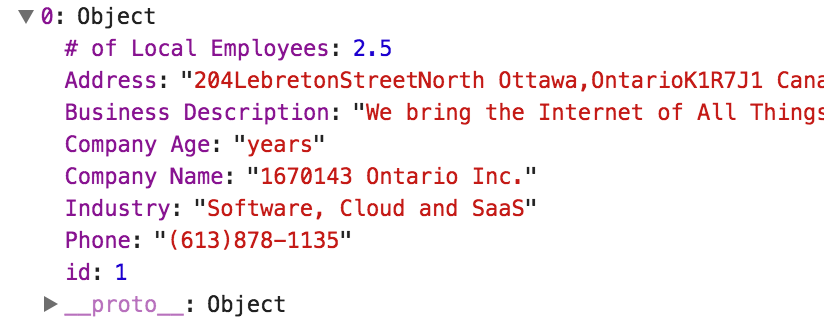
I know I'm missing something, since the conversion happens with no errors, but the data gets lost in the mids of it.
Looking at last link that you posted in your previous response, I noticed that block of code, which I think is most relevant to my issue:
geometry: new Point({
x: feature.geometry.coordinates[0],
y: feature.geometry.coordinates[1]
}),
// select only the attributes you care about
attributes: {
ObjectID: i,
title: feature.properties.title,
type: feature.properties.type,
place: feature.properties.place,
depth: feature.geometry.coordinates[2] + " km",
time: feature.properties.time,
mag: feature.properties.mag,
mmi: feature.properties.mmi,
felt: feature.properties.felt,
sig: feature.properties.sig,
url: feature.properties.url
}I haven't noticed any use of fromJSON() at all though.
I also noticed that instead of using new Graphic() its using new Point() . is there a difference between Graphic and Point? Ultimately I'm looking to populate the the map with a new FeatureLayer that will distribute the points according to the address in the response object.
Now I also noticed the presence of the x and y properties, in my response object there is no sign of x and y coordinates, like I mentioned above, I was hoping to populate the points using the address property in my response object.
How do I know what should go in the attribute property of my Graphic object, is that where my: address, # of local employees, company name... should go?
Thanks again Jordan for your patience and guidance. I posted the following pictures and code sample to make it as understandable as possible. Hopefully my issue once solved will be able to help other developers that have similar issue.
Thank you,
Anton.
- Mark as New
- Bookmark
- Subscribe
- Mute
- Subscribe to RSS Feed
- Permalink
Hey Anton,
You're close. That code block you pasted in is the key to this. That defines the structure of a Graphic object, which your JSON needs to conform to, in order to create a proper Graphic. A Graphic is an object which stores both Geometry (a Point, Line, Polygon etc.) and Attributes for that graphic. Also note that you will need to have some kind of unique identifier in your attributes. Generally Esri calls this the OBJECTID, but it can be called anything, as long as the name of the unique ID field is specified when defining the Feature Layer fields (see example below).
You cannot populate the Geometry using a street address, you need to convert this to x, y coordinates somehow first. To do this, you'll need to use a Geocoder. Esri has a Geocoder available, but you need to sign up as a Developer in order to get access to it: Geocoding and Place Search | ArcGIS for Developers . This is also going to add another layer of complexity to your code.
You're correct, you need to use your address, company name etc. as the attributes. Here is an example for you, which is doing most of what you want, except for the geocoding to get x, y coordinates from a street address: JS Bin - Collaborative JavaScript Debugging
If you decide to use the Esri Geocoder above, it shouldn't be to hard to plug that in and create the Geometry.
Cheers,
Jordan
- Mark as New
- Bookmark
- Subscribe
- Mute
- Subscribe to RSS Feed
- Permalink
Hello Jordan,
Sorry for the late response, I was having major progress thanks to your guidance!
I managed to show the points on the map just like in the example that you provided me.
However I have some other issue relating to graph in popups and measuring distance, but that I suppose is more suitable for a new topic in the forum.
I appreciate your help and effort, I learned a lot thanks to you,
Thank you,
Anton.
- Mark as New
- Bookmark
- Subscribe
- Mute
- Subscribe to RSS Feed
- Permalink
Anton,
I am working on a similar issue and need to get a layer to plot locations from a JSON Feed from my specific API web service.
The example above is a big help but I am struggling to figure out how to pull the JSON feed from my web service.
Any chance you can provide an example of how you got it to work?4
Thanks
- Mark as New
- Bookmark
- Subscribe
- Mute
- Subscribe to RSS Feed
- Permalink
Matt,
Do you know how to call the web service from a browser? Is it a SOAP or RESTfull web service?
- Mark as New
- Bookmark
- Subscribe
- Mute
- Subscribe to RSS Feed
- Permalink
It’s a restful web service
- Mark as New
- Bookmark
- Subscribe
- Mute
- Subscribe to RSS Feed
- Permalink
Matt,
Then you just use esriRequest then.
esri/request | API Reference | ArcGIS API for JavaScript 3.21
- Mark as New
- Bookmark
- Subscribe
- Mute
- Subscribe to RSS Feed
- Permalink
Hi
I have json data coming from different web service , i am able to plot points on map using this json data. how can i show this data in the feature table?