- Home
- :
- All Communities
- :
- Products
- :
- ArcGIS Insights
- :
- ArcGIS Insights Questions
- :
- Re: How to use Chord Diagram, Data Clock, Heat Cha...
- Subscribe to RSS Feed
- Mark Topic as New
- Mark Topic as Read
- Float this Topic for Current User
- Bookmark
- Subscribe
- Mute
- Printer Friendly Page
How to use Chord Diagram, Data Clock, Heat Chart
- Mark as New
- Bookmark
- Subscribe
- Mute
- Subscribe to RSS Feed
- Permalink
Hi,
I want to use Chord Diagram for an Insights for ArcGIS Demo, i have last version of insight, 1.2.1...
Is it a new types of Diagram wich will be availabale for next release?
Thanks for help,
Asma
Solved! Go to Solution.
Accepted Solutions
- Mark as New
- Bookmark
- Subscribe
- Mute
- Subscribe to RSS Feed
- Permalink
Hi Asma NKHILI,
Apologies for the lack of response on this question.
Please see the v2.x Chord Diagram doc for information about creating chord diagrams.
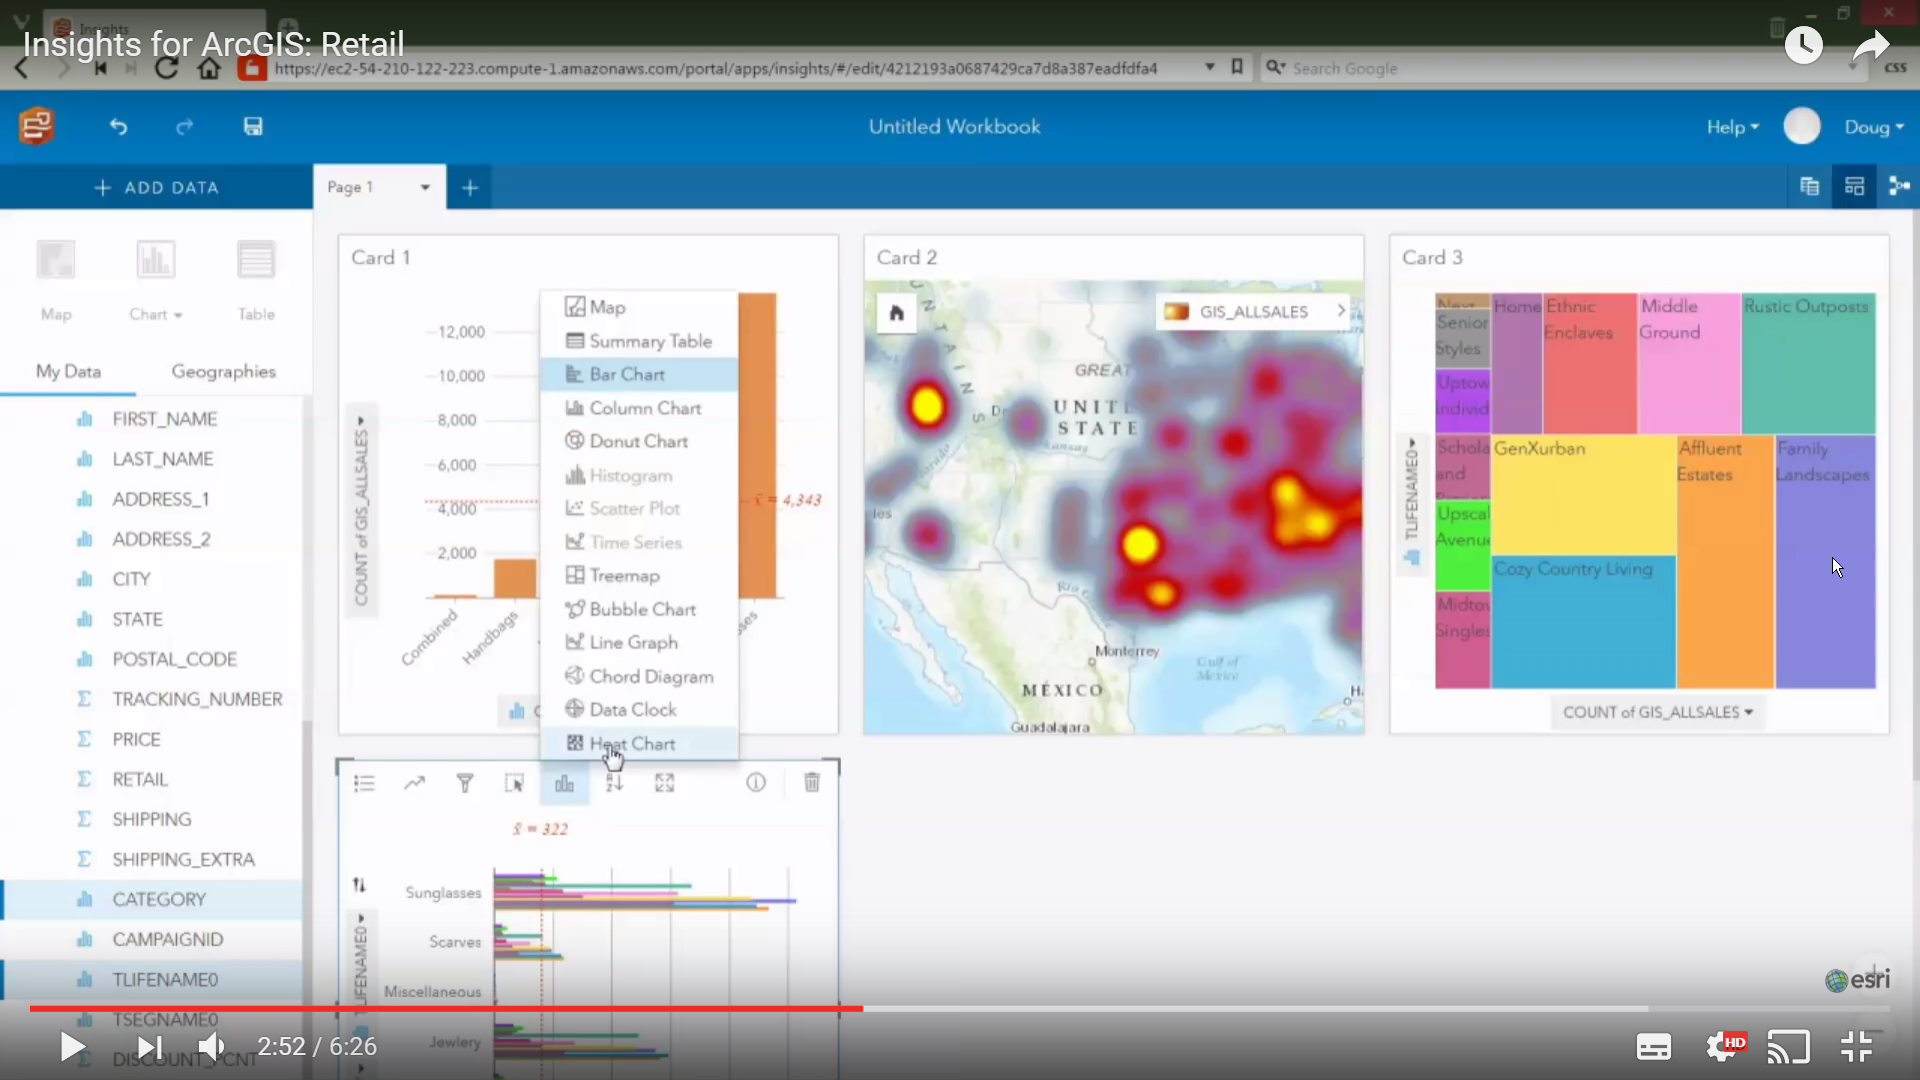
You can create a chord diagram by selecting two category fields and, optionally, a number or rate/ratio field and either dragging the fields to the Chart drop zone and changing the Visualization type to Chord Diagram, or choosing Chord Diagram from the Chart drop-down menu above the data pane.
Thanks,
Nathan
- Mark as New
- Bookmark
- Subscribe
- Mute
- Subscribe to RSS Feed
- Permalink
Hi Asma NKHILI,
Apologies for the lack of response on this question.
Please see the v2.x Chord Diagram doc for information about creating chord diagrams.
You can create a chord diagram by selecting two category fields and, optionally, a number or rate/ratio field and either dragging the fields to the Chart drop zone and changing the Visualization type to Chord Diagram, or choosing Chord Diagram from the Chart drop-down menu above the data pane.
Thanks,
Nathan