- Home
- :
- All Communities
- :
- Products
- :
- ArcGIS Insights
- :
- ArcGIS Insights Questions
- :
- Re: How to edit the Donut chart-Donut thickness?
- Subscribe to RSS Feed
- Mark Topic as New
- Mark Topic as Read
- Float this Topic for Current User
- Bookmark
- Subscribe
- Mute
- Printer Friendly Page
- Mark as New
- Bookmark
- Subscribe
- Mute
- Subscribe to RSS Feed
- Permalink
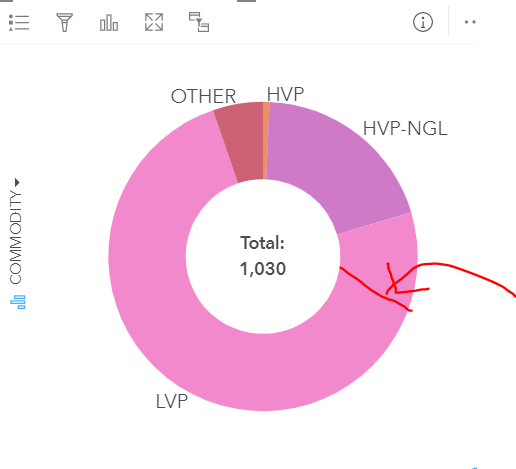
I am trying to edit the thickness of the donut chart. Can anyone help? Also Want to know how to change the labels like here OTHER, HVP, HVP-NGL, LVP?
Solved! Go to Solution.
Accepted Solutions
- Mark as New
- Bookmark
- Subscribe
- Mute
- Subscribe to RSS Feed
- Permalink
Hi,
The proportions shown in the chart are controlled by the data itself so can't be changed. Labels are, again pulled directly from the data but there are two ways you can make changes.
Firstly, you can open the data table and do a field calculation to reformat strings to be as you wish or, secondly, you can use a look up table. To do this, create a new table e.g. in excel and in one field add any strings used your data that you need for the chart e.g. OTHER and create a second field containing the label you want e.g "Other/unknown". Use create relationships to join on the field in common and use you new field as the display field in the chart.
- Mark as New
- Bookmark
- Subscribe
- Mute
- Subscribe to RSS Feed
- Permalink
Hello there!
Could you expand on what you mean by "editing the thickness of the donut?" Do you mean making the shape itself larger, or making the categories appear larger?
Additionally, the labels are based off of the column names in your base data. I will investigate to see if changing them is possible and report back.
- Mark as New
- Bookmark
- Subscribe
- Mute
- Subscribe to RSS Feed
- Permalink
Hi,
The proportions shown in the chart are controlled by the data itself so can't be changed. Labels are, again pulled directly from the data but there are two ways you can make changes.
Firstly, you can open the data table and do a field calculation to reformat strings to be as you wish or, secondly, you can use a look up table. To do this, create a new table e.g. in excel and in one field add any strings used your data that you need for the chart e.g. OTHER and create a second field containing the label you want e.g "Other/unknown". Use create relationships to join on the field in common and use you new field as the display field in the chart.