- Home
- :
- All Communities
- :
- Products
- :
- ArcGIS Insights
- :
- ArcGIS Insights Questions
- :
- Change in how Insights builds Joins?
- Subscribe to RSS Feed
- Mark Topic as New
- Mark Topic as Read
- Float this Topic for Current User
- Bookmark
- Subscribe
- Mute
- Printer Friendly Page
- Mark as New
- Bookmark
- Subscribe
- Mute
- Subscribe to RSS Feed
- Permalink
In my work we've been struggling through some join issues lately. Before you jump into asking "well what are you really trying to do?" ... this question is only about identifying if Insights has changed how it handles joins, and not about troubleshooting the data
One thing we noticed is that we cannot seem to perfectly re-create the structure of a joined layer we created in Insights in November, now in late December. We are not sure if how Insights builds a joined layer has changed.
In both cases we created a relationship in Insights between two layers, using a full join, based on location.
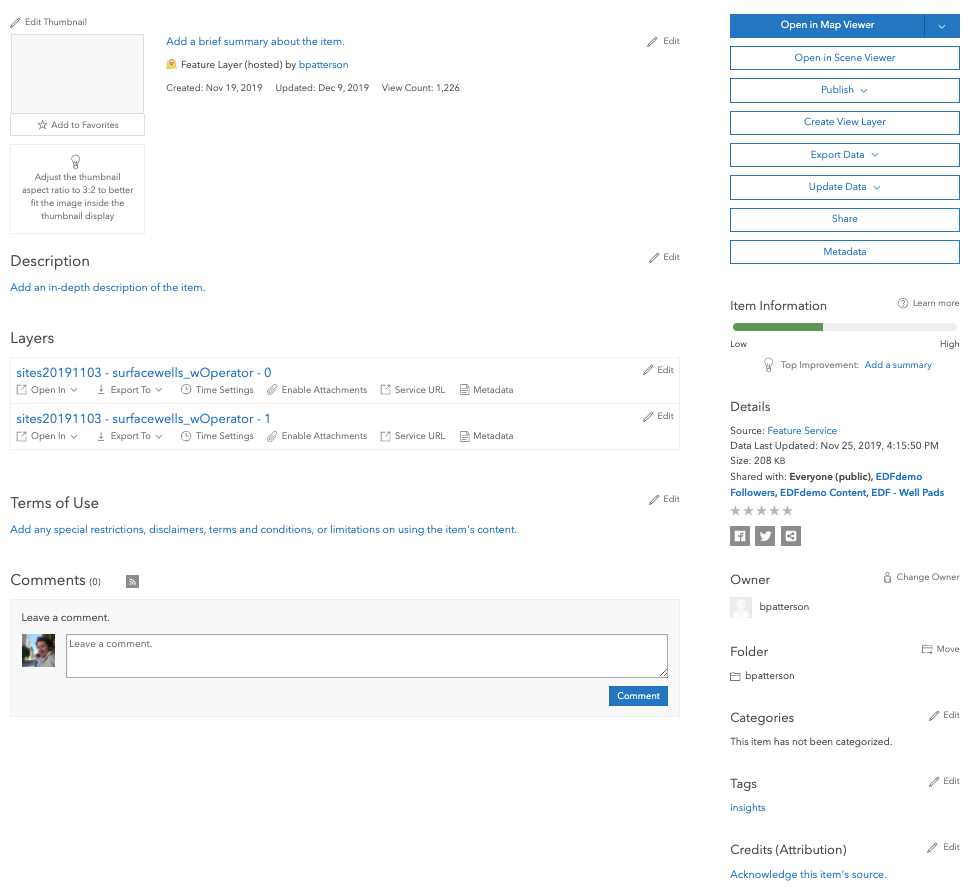
In particular, the output of the original join we did in November only included the two joined layers.
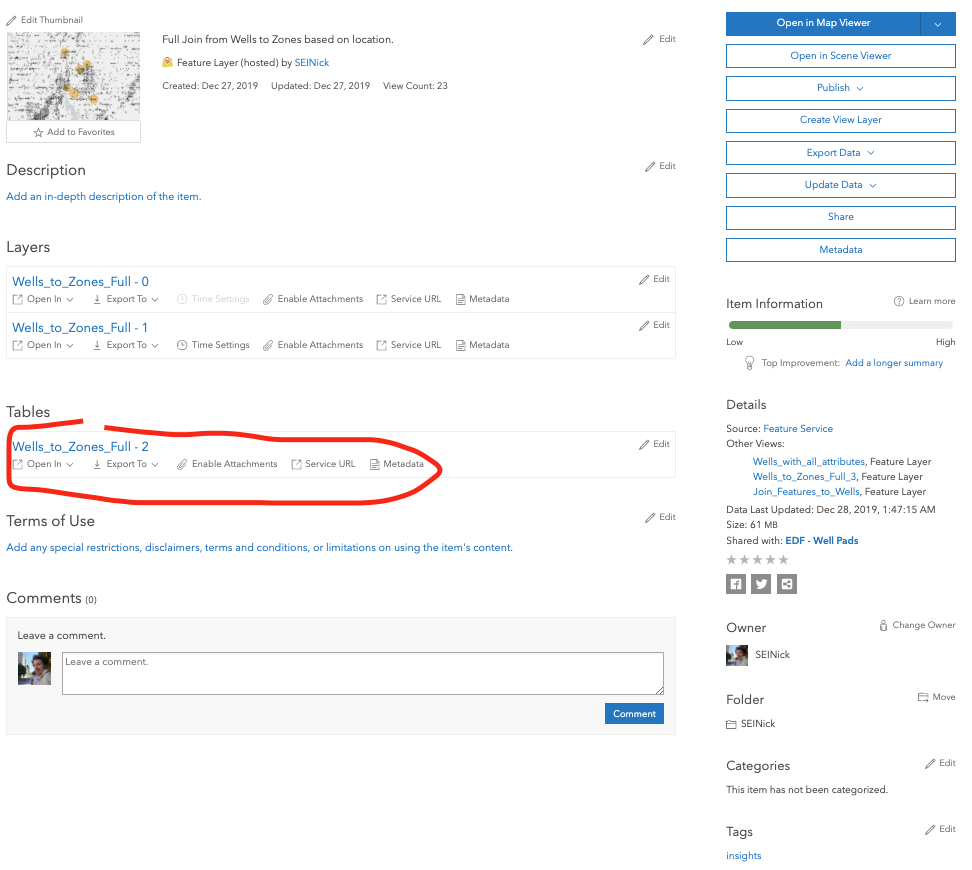
However, now we are trying to re-create the same sort of join with newer data, and finding that the output from Insights includes a third item ... a "table" of the join.
My main question is simply - has there been a change in how Insights does these joins, or are we somehow not doing the same thing we thought we did before? I feel fairly confident we are doing the same sort of relationship building and sharing we did before, because we can't see any other options in Insights that give us this output. But :Shrug: we aren't totally sure. Does it somehow matter what data is being joined? We are working with example data ... the example data from November was more rudimentary. The new example data has more detail. Does that explain this "table" showing up in the join result? Ultimately the reason we are using Insights here is because it provides the option to do a full join, that we do not see as an option elsewhere in AGO... and we are trying to avoid using desktop GIS tools (Pro, Map, etc.).
Thanks for any info!
Solved! Go to Solution.
Accepted Solutions
- Mark as New
- Bookmark
- Subscribe
- Mute
- Subscribe to RSS Feed
- Permalink
Hi Nicholas,
In short, yes we did make some changes as to how we handle joins in ArcGIS Insights.
It is expected that in some cases a 3rd table is created and is related to work done with many-to-many joins, where a bridge table is not provided. The 3rd table you are seeing is, effectively, a bridge table that we now auto-generate in Insights to ensure we have effective and functioning many-to-many joins in all cases.
- Mark as New
- Bookmark
- Subscribe
- Mute
- Subscribe to RSS Feed
- Permalink
Any thoughts Linda Beale or Scott Sandusky?
- Mark as New
- Bookmark
- Subscribe
- Mute
- Subscribe to RSS Feed
- Permalink
Hi Nicholas,
In short, yes we did make some changes as to how we handle joins in ArcGIS Insights.
It is expected that in some cases a 3rd table is created and is related to work done with many-to-many joins, where a bridge table is not provided. The 3rd table you are seeing is, effectively, a bridge table that we now auto-generate in Insights to ensure we have effective and functioning many-to-many joins in all cases.
- Mark as New
- Bookmark
- Subscribe
- Mute
- Subscribe to RSS Feed
- Permalink
Linda,
Thank you!
It is expected that in some cases a 3rd table is created
Is there any way you can elaborate on what the cases are?
In our own explorations we've found that if we do a join (in Insights) from our big point layer (wells) to a polygon layer that we derive (say via buffering, or a tool such as the KML to polygon tool), then we are now getting that auto-generated "bridge" table. But if we create a brand new polygon hosted feature layer in AGO, and draw some polygons into.. then joining against it with the same join parameters does not generate a bridge table.
Is the bridge table generation based on thresholds? Or some other behind the scenes configuration in hosted feature layers?
Thank you for helping us understand this.
-Nick
- Mark as New
- Bookmark
- Subscribe
- Mute
- Subscribe to RSS Feed
- Permalink
Hi Nicholas,
Insights now generates the third table when it determines that a many-to-many (m2m) join is missing a bridge (aka junction) table.
When joining 2 tables on some field A, if A has duplicate values in both tables, then that's a m2m join. Typically in data modeling, a m2m relationship is constructed as a combination of a 1-m and m-1 relationships between 3 table. For example:

In cases where that bridge table is missing, Insights will create one and populate it with the right combination of matching keys based on the join type (full, left, inner, right). Hence, the 3rd table you see when you share the joined dataset.
This improvement should make m2m joins more stable overall, and allow you to use the result in further analysis.