- Home
- :
- All Communities
- :
- Products
- :
- ArcGIS Hub
- :
- ArcGIS Hub Questions
- :
- Re: Straight Line on ArcScene after adding Z-coord...
- Subscribe to RSS Feed
- Mark Topic as New
- Mark Topic as Read
- Float this Topic for Current User
- Bookmark
- Subscribe
- Mute
- Printer Friendly Page
Straight Line on ArcScene after adding Z-coordinate
- Mark as New
- Bookmark
- Subscribe
- Mute
- Subscribe to RSS Feed
- Permalink
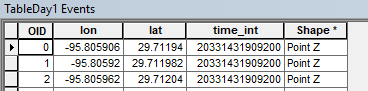
I'm trying to do space-time analysis on ArcScene. In doing so, I'm using Add XY data to input my tabular data. When I input X and Y values, I get a normal map in 2D, but when I add the third axis (time), it just gives me a straight line on ArcScene and X and Y values loose their significance. (Note: My time column has values in HHMMSS.SS format)
This is my data
This is the ArcScene output I get after importing XYZ data

- Mark as New
- Bookmark
- Subscribe
- Mute
- Subscribe to RSS Feed
- Permalink
If looks like your longitude and latitude are from a very limited range relative to the z
- Mark as New
- Bookmark
- Subscribe
- Mute
- Subscribe to RSS Feed
- Permalink
Hi Dan,
I tried taking log of the time column but still getting a single line point values. Now my log_time ranges from 33-36 which is comparable to the latitude and longitude
- Mark as New
- Bookmark
- Subscribe
- Mute
- Subscribe to RSS Feed
- Permalink
I assume you have not defined a particular vertical coordina system for the data, right? In that case it will assume the same unit used for the X and Y values to be used for the Z values leading to unwanted results. You could create another field that expresses the time from the start time and use a different unit (minutes, hours days, depending on the range of time values). What is your use case for using time as Z axis? What do you want to visualize?
Normally time is used to visualize an animation of movement over time (in 2D or in 3D, if you have Z values)
- Mark as New
- Bookmark
- Subscribe
- Mute
- Subscribe to RSS Feed
- Permalink
Yes, I'm visualizing space-time variation of my data in 3D. When i try to use my time field as Z-axis, it doesn't show up on ArcScene's 'Add XY Data' as its not of integer form. This was the reason I was trying to convert the time to integer and then use it.
- Mark as New
- Bookmark
- Subscribe
- Mute
- Subscribe to RSS Feed
- Permalink
For space-time analysis have a look at: An overview of the Space Time Pattern Mining toolbox—Help | ArcGIS Desktop