ArcGIS GeoPlanner Blog

cancel
Showing results for 
Show  only  | Search instead for 
Did you mean: 

Other Boards in This Place


Latest Activity

(8 Posts)
AngeliqueSamaro
Esri Contributor

ArcGIS GeoPlanner app was recently updated. The latest October update include fixes for issues reported by this community and improvement to the user experience.

Read more...

more
3 0 427
jos20
by Esri Contributor
Esri Contributor

Green infrastructure details and how ArcGIS GeoPlanner's template facilitates planning.

Read more...

more
2 0 624
SaraEddy
Esri Contributor

ArcGIS GeoPlanner has recently been updated to version 3.6. Aside from general toolbox performance and stability enhancements, the GeoPlanner 3.6 update focuses largely on the weighted raster overlay (WRO) service toolbox. The WRO service toolbox enhancements include support for the following image raster formats:

  • TIFF
  • Cloud Optimized GeoTIFF
  • Cloud Raster Format (CRF)
  • Meta Raster Format (MRF) 

This new update also includes changes to building a mosaic. Before, users did not have the option to manually select the layers they wanted to include in a mosaic, but now users can specify the active layers they want to use. The final mosaic can then be shared to your ArcGIS organization. This update also allows for quicker access to the properties of a design layer through the options button.

more
2 0 710
MrinmayeeBharadwaj
Esri Regular Contributor

Esri User Conference 2020 has many virtual sessions across hundreds of topics. Below is a focused agenda to help you navigate your way to ArcGIS GeoPlanner activities.

*Please register as a full-access attendee to watch sessions and participate in the virtual expo at Esri UC 2020!

Start Here: Virtual Showcase

https://uc2020.esri.com/showcase/11EABB19EFDC4C3082654F82FCF35551/3D-GIS/11EABB19C9E70B0082654F82FCF... 

Monday, July 13 12:05 PM–3:50 PM PST

Tuesday, July 14 7:30 AM–9:40 AM and 11:10 AM–3:50 PM PST

Wednesday, July 15 7:30 AM–9:40 AM and 11:10 AM–3:50 PM PST

For general questions and demos regarding ArcGIS GeoPlanner visit the ArcGIS GeoPlanner Booth ID: SH-18-06 to Chat or Schedule a Meeting with a product expert. (Located in the 3D area)

For questions and demos about how ArcGIS GeoPlanner supports green infrastructure (GI) initiatives visit the Conservation Booth ID: SH-15-01 to Chat or Schedule a Meeting with a GI expert. (Located in the Sustainable World area)

........................................................................................................................................................................

On-demand Sessions:

The following sessions are available for interested attendees to watch on their own time.

ArcGIS GeoPlanner is a premium web application for iterative multiscale planning. GeoPlanner comes equipped with project templates, rich libraries of environmental and other data, and analytical capabilities for kickstarting your work. Join us and learn how to use GeoPlanner to create, analyze, and report on planning alternatives. We will highlight many capabilities, including modeling and analysis, sketching, key performance indicators, and scenario management to improve decision making and facilitate more robust and collaboratively driven planning.


This session covers how you can configure suitability models, also known as weighted raster overlays, within ArcGIS GeoPlanner and other select advanced capabilities of the application. The suitability models covered represent a robust analytical tool used to help better understand your environment, explore relationships amongst your data, and provide a clearer understanding of favorable locations for activities. The session will explore how advanced configurations help foster collaboration, enhance transparency, and provide greater access to stakeholders at large given their ease of use and accessibility via the web.

Esri’s Green Infrastructure (GI) initiative is a collection of freely available authoritative geospatial resources, newly generated data, online applications, and downloadable models with the aim of empowering citizens, organizations, and governments to engage in GI work, all while initiating a national vision for GI planning. Join us in exploring this content, including data updates derived from the latest land cover release, that help to identify your regions most valuable natural assets, how they are changing, and where they are being lost. Learn how to access this vast ecosystem of online resources via the Living Atlas and see GI planning in action with ArcGIS GeoPlanner, a premium application for geodesign and scenario-based planning.

........................................................................................................................................................................

Related UC Special Interest Group (SIG) Virtual Meetings (Streaming Live):

Thursday, July 16

6:45 AM PST

Conservation SIG

6:45 AM PST

Environment & Natural Resources SIG

6:45 AM PST

Non-Profit and Sustainable Development SIG

10:30 AM PST

Forestry SIG 3:30 PM PST

Renewables SIG

........................................................................................................................................................................

ArcGIS GeoPlanner QuickLinks:

· Product page

· Training

· Contact the team anytime at geoplanner@esri.com

See you at the UC!!!

more
0 0 1,526
MrinmayeeBharadwaj
Esri Regular Contributor

Blog text by: Ryan Perkl

GeoPlanner for ArcGIS is a web-based planning and design tool that empowers you to iteratively analyze, design, and evaluate multi-scale scenarios in a collaborative environment.  


  • Design by understanding how dependent systems and environmental concerns interact within your project.  
  • Configure charts, graphs, and gauges to interpret and compare the success of your designs.  
  • Communicate project suitability, performance, and impact by sharing your data-informed plans.  
  • Use striking metrics and visuals show the relationship between design and impact to tell your compelling story. 
  • Take full advantage of its larger web-GIS environment to engage experts, collaborators, and stakeholders across a wide variety of topical domains. 

The Road Ahead... 

ArcGIS GeoPlanner’s Strategic Pivot to Support Landscape and Natural Systems Planning: 


At its heart, ArcGIS GeoPlanner is a scenario-based planning and design tool. While GeoPlanner will continue to be an applicable tool for supporting urban and land use planning, the application will be making a strategic pivot to focus on landscape and natural systems planning.

Planning with the landscape’s natural characteristics in mind is often an afterthought, GeoPlanner brings this information front and center, therefore allowing users to develop context-specific scenarios for improving the environmental performance of a project. 


GeoPlanner will evolve into the go-to application for users engaged in scenario planning related to: 


  • Conservation Planning  
  • Environmental Planning 
  • Forestry Management 
  • Green Infrastructure Planning 
  • Natural Resources Management 
  • Protected Areas Planning and Management 
  • Stormwater Management 
  • Watershed Planning 

New Capabilities to Support Environmental Workflows! 


With this shift to support landscape and natural systems planning, new capabilities are envisioned to better support environmentally focused workflows including:  


  • Advanced Key Performance Indicator capabilities and Baseline Modifiers intelligently linked to on-the-ground conditions, reflect the performance and impact of each design. 

  • Environmental Conflict Screening and Reporting allows you to quickly identify opportunities and constraints within existing conditions and your proposed design. 


  • Modernized Weighted Raster Overly (WRO) Model takes full advantage of ArcGIS Online and its latest Imagery Service, streamlining the configuration process and enhancing the ease by which users can publish and host their own models. 

  • New analysis capabilities using Zonal Statistics allow you to enrich boundary data; prioritize parcels, watersheds, management districts with valuable information to support desired functions. 


Stay tuned ... additional updates and other exciting new capabilities coming soon!!!

more
0 0 1,114
NancyMorales1
Frequent Contributor

We recently updated GeoPlanner for ArcGIS to version 2.6. Since our last release, we’ve made significant improvements to GeoPlanner for ArcGIS and the Suitability Modeler Widget in the Web AppBuilder. At this update of GeoPlanner, we’ve made it easier for you to explore your data by allowing you to access attribute tables and use more layers in the dashboard. We also made it easier to organize Key Performance Indicators (KPIs).


View, sort and rank attribute table data

At this update, you can now access attribute tables of design and feature layers. This will help you better understand your data by allowing you to view, sort, and get statistics on your data. Need to rank your data by an attribute value? It’s easy at this update – just open the table and sort on a field to find the highest or lowest values within a layer. If you have editing privileges, you can also update attribute values in your layers. 


Key performance indicators

Do you have lots of key performance indicators in a GeoPlanner project? We just made it easier to manage KPIs. Now you can sort your KPIs into your preferred order by dragging and dropping them in the Dashboard’s KPI dropdown list. The will also update the display order of KPIs in the Dashboard.

More layers in summary chart

When using a chart for your projects, reviewing the summary can provide great insight into your data. The summary chart reports on areas of overlay between two layers, to better help you understand the impact between them. For example, what’s the impact of wildlife on areas where development is a possibility but the area is not under conservation efforts?

With this update, you can use layers with simple, unique values, classified and visual variable symbology in the summary chart. The benefit of this is that it will allow you to use certain tools in the summary chart directly. Tools such as Create Travel-Time Areas, Aggregate Points, Calculate Density, and more.


Summarize model score in the Suitability modeler widget

At this update to the Web App Builder’s Suitability Modeler Widget you can view a summary chart of model scores. This chart resembles the summary chart in GeoPlanner in that it enables you to summarize model scores within a sketch, graphic or feature. This will help your users analyze and gain insight into how an area behaves or performs. 

Don’t have GeoPlanner? Don’t worry! You can try it for free. Follow these instructions on how to access a free trial. Click on the Don’t have an ArcGIS Online subscription link.

more
0 0 1,147
PraveenSrivastava
Frequent Contributor

Create 2D planning scenarios in GeoPlanner and visualize them in 3D in ArcGIS Pro

These are exciting times for the city of Hartford, Connecticut. A new bus rapid transit (BRT) line, CTfastrak, has recently opened, connecting the city to several communities in central Connecticut. Furthermore, minor league baseball is coming to town, as the Hartford Yard Goats prepare for their debut in 2016. The city now faces the challenge of successfully integrating the upcoming sports entertainment development with the new BRT line in order to maximize the impact of both multi-million dollar projects.

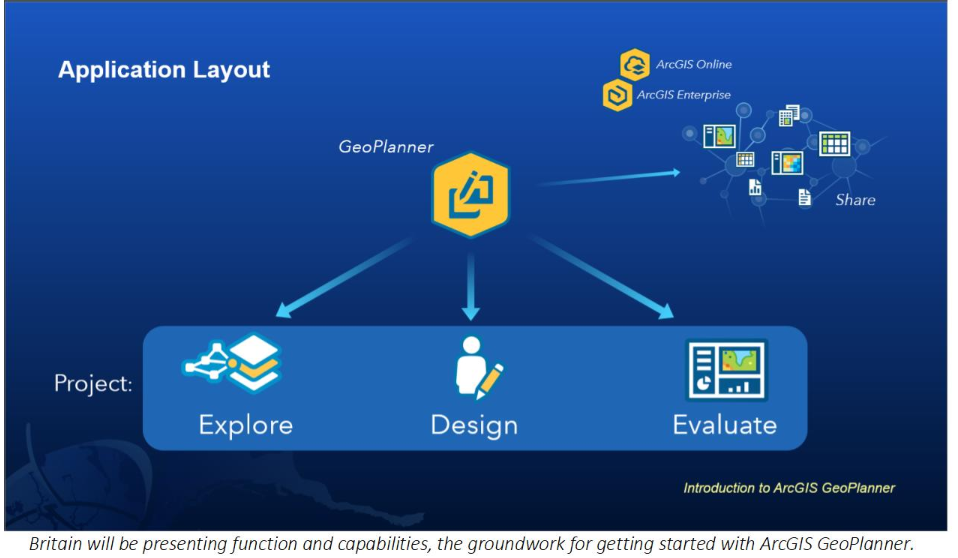
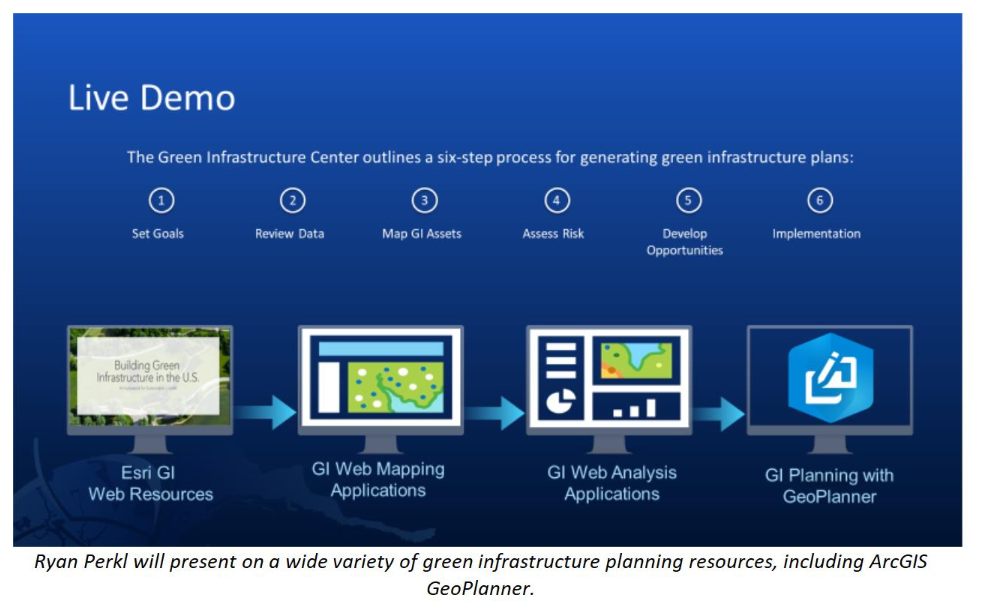
As part of the ArcGIS platform, GeoPlanner for ArcGIS and ArcGIS Pro can help city decision-makers and planners understand and visualize the dynamics of urban infrastructure projects as well as help them optimize the impact of these projects. GeoPlanner and ArcGIS Pro offer new opportunities to incorporate GIS into planning and design practices. GeoPlanner allows you to create and assess multiple planning alternatives. ArcGIS Pro helps you understand these alternatives through 3D visualization. The ArcGIS Platform transfers changes between these applications. This enables uninterrupted workflows and helps to facilitate valuable insights.

Create and Evaluate Plans across a Synchronized Platform

Let’s say your organization has GIS professionals who use ArcGIS Pro and a planning team that works with GeoPlanner. The ArcGIS Platform can help these two groups collaborate on projects through the sharing of data, analysis, and information.

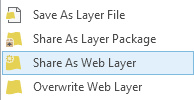
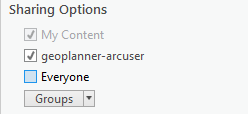
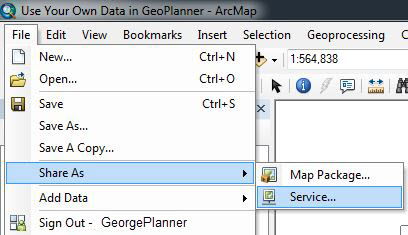
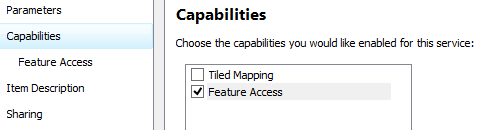
GeoPlanner scenarios and analysis results are saved to ArcGIS Online as hosted feature layers. These layers can be accessed and rendered in 3D in ArcGIS Pro. 3D visualization helps you evaluate the impact of current conditions and proposed changes within your study area. For example, you can explore how the orientation of surrounding buildings affects your proposed development. Valuable insights gleaned from visualizations in ArcGIS Pro promote evidence-based and analysis-driven design alternatives in GeoPlanner.

Changes you make to hosted feature layers are available in real-time in both GeoPlanner and ArcGIS Pro. As a result, ArcGIS Pro and GeoPlanner comprise a synchronized platform for seamless geodesign workflows.

Using GeoPlanner and Pro Seamlessly

Let us now explore how GeoPlanner and ArcGIS Pro can be used in tandem to locate and plan the optimal site for construction of a minor league baseball stadium in Downtown Hartford, Connecticut.

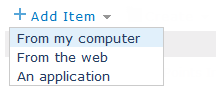
We begin by importing our data into a scenario which will model the current built conditions and zoning districts in Downtown Hartford.

esri_insider_JP_1_640.jpg

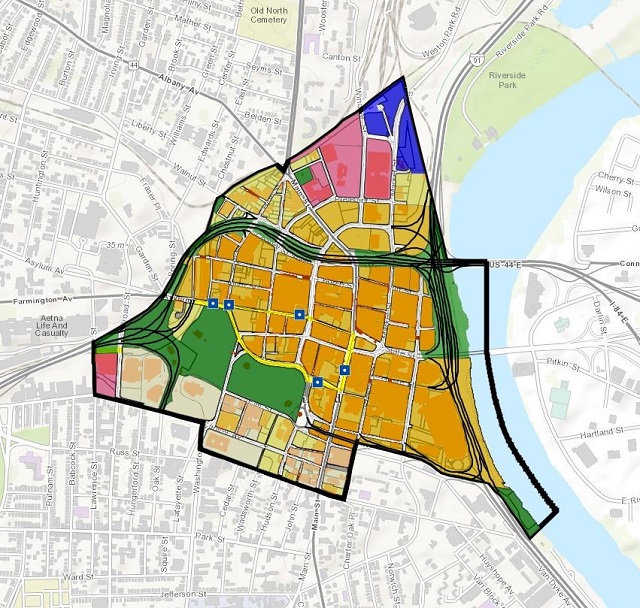
The scenario shown above has a transportation layer, point of interest layer, and land use layer, and additional contextual layers such as parcels and building footprints to supplement the scenario.

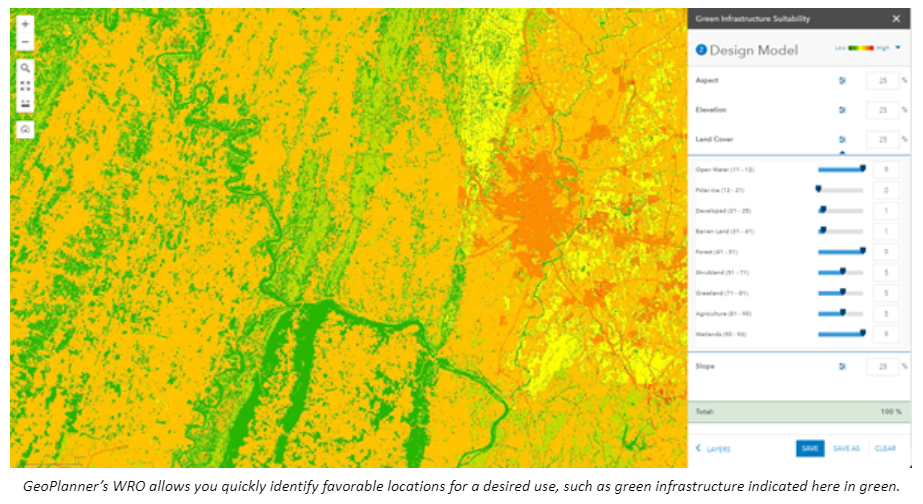
We can further create layers showing both suitable and unsuitable land for stadium construction by using GeoPlanner’s analysis tools. Since the city is proposing a 220,000 square foot stadium, we’ll look for areas where contiguous parcels meet this square footage requirement. GeoPlanner’s sketching and visualization tools combined with knowledge of the local area help us further refine our search. For example, although a parcel on the state capitol building grounds has the requisite area, it is unsuitable for stadium construction.

Using analysis tools, sketching tools, and scenarios, we conclude that there are three possible areas of contiguous parcels upon which to construct the Yard Goats stadium. We will determine which site is best positioned to promote use of CTfastrak among Yard Goats fans as they head to the stadium on game day.

This conclusion is best reached by combining GeoPlanner’s analysis tools with its visually instructive classification scales. We see that there is only one contiguous area of parcels upon which to build the stadium in order to promote CTfastrak use among Yard Goats fans.

esri_insider_JP_2_640.jpg

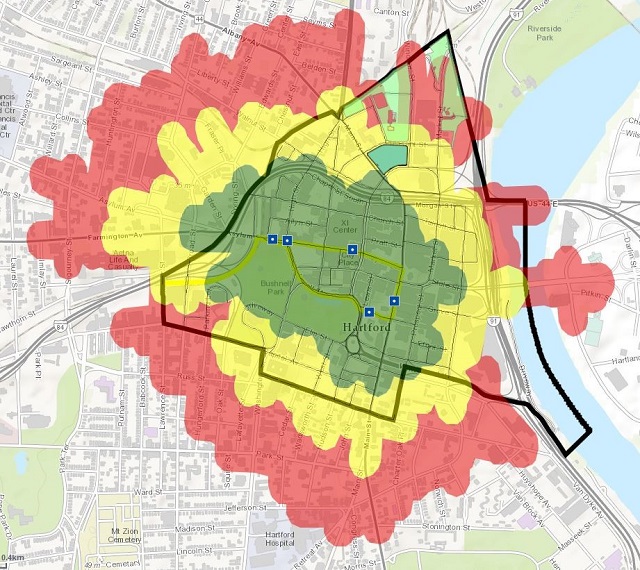
By using the Create Travel-Time Areas tool, we can model the distance that a pedestrian could feasibly travel from a CTfastrak Route 101 transit stop in 5, 10, or 15 minutes. We classify these travel times on an intuitive color classification scale, with a 5 minute walk designated as optimal (green).

With our location for stadium construction identified, we now use the 3D visualization capabilities of ArcGIS Pro to determine the orientation of the stadium. Modeling the design of our stadium to be similar to those of other minor league baseball teams, we set a 9,000 seat capacity with no outfield seating. Therefore, we determine that the stadium should be oriented with home plate somewhere along the northern or western edge of the final location, since this would allow for excellent grandstand views of the skyline of Downtown Hartford or the nearby Connecticut River.

esri_insider_JP_3_640.jpg

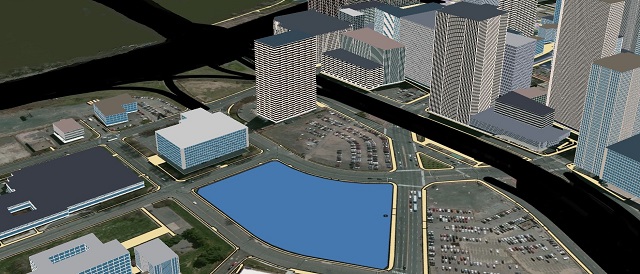
Locating home plate close to the corner of Pleasant & Main Streets would allow spectators to take in an aesthetically-pleasing view of the city.

Bringing the Yard Goats to Hartford is a boon for the city. By constructing a baseball stadium within walking distance of a CTfastrak transit stop, the city can promote the use of public transit as an enjoyable, affordable, and fun part of a family-friendly summer activity: taking in a ballgame in the heart of Hartford.


How Do I Get Started?

Choosing to work with both GeoPlanner and ArcGIS Pro is a smart decision for planners and decision-makers in all industries. Learn more and request a free trial of GeoPlanner for ArcGIS and ArcGIS Pro to start taking advantage of the planning power of these applications today.

more
7 2 2,881
PraveenSrivastava
Frequent Contributor

Want to bring your own datasets into GeoPlanner for ArcGIS? With GeoPlanner, leveraging your own data is easy. You share your feature data to ArcGIS Online and then access this data in GeoPlanner for visualization, sketching, analysis, and evaluation. Below are instructions on how to publish your datasets from ArcGIS Pro, ArcMap, and ArcGIS Online and access them in a GeoPlanner project.

ArcGIS Pro

ArcGIS Pro and GeoPlanner comprise a synchronized platform for seamless geodesign workflows. The following steps will help you share your data from ArcGIS Pro to ArcGIS Online:

Step 1: Right-click a feature layer in the Contents pane and choose Share as Web Layer.

Share as web layer

Step 2: In the Share Web Layer tool, add a summary and tags. Make sure the Features option is checked on. This tool also allows you to set sharing permissions. You can choose to share with your organization, Everyone or a group.

Sharing

Step 3: Click Analyze on the bottom of the panel. Once any errors are fixed, click Publish.

ArcMap

Sharing your own data from ArcMap to ArcGIS Online is also a straightforward process.

Step 1: Select File > Sign In to open the ArcGIS Online Sign In dialog. Enter your Username and Password.

Step 2: From ArcMap’s File menu, click Share As > Service.

Sign In Menu

Step 3: Navigate through the Publish a Service dialog box, making sure to choose your Hosted Services connection.

Step 4: In the Service Editor, click on Capabilities and check on Feature Access. Feature Access allows you to use this data in GeoPlanner’s dashboard, import scenario and analysis tools. Optionally, check off Tiled Mapping.

Service Editor Capabilities

Step 5: Click on Item Description and add a summary and tags.

Step 6: Click on Sharing and share with your organization, Everyone, or a group.

Step 7: Click Analyze on the top of the Service Editor dialog. Resolve any errors and click Publish to push your data to ArcGIS Online.

ArcGIS Online

Do you have shapefiles or file geodatabases that you want to share but don’t have access to ArcGIS Pro or ArcGIS for Desktop? You can share them using the Add Item tool in ArcGIS Online! The ArcGIS Online publishing process will automatically create hosted feature layers from the data you have uploaded.

Step 1: Compress your shapefiles or file geodatabases in a ZIP file.

Step 2: Sign in to ArcGIS Online and navigate to My Content. Click Add Item and choose From my computer.

Add Item

Step 3: Browse to your zipped data. Don’t forget a title, summary, and tags!

Step 4: Click Add Item to upload your zipped data and create a new hosted feature layer.

Add your data in GeoPlanner

You’re almost done! Simply add these newly hosted feature layers to a GeoPlanner project.

Step 1: In GeoPlanner, open a project and move to the Data segment.

Add Data

Step 2: Click on the Add Data icon. The Search for Data dialog appears.

Step 3: In the Search for Data dialog, click My Content. Feature layers that you have published to ArcGIS Online can be found here. Search for your feature layers by name or tags.

Step 4: Click the Add button to add a layer to GeoPlanner!

Other types of layers

Feeling comfortable with uploading your own feature data for use in GeoPlanner? You can add map and image layers to a GeoPlanner project. If you have these types of layers hosted in ArcGIS Server or Portal, add their URLs as items to ArcGIS Online. Then discover these items using GeoPlanner’s Add Data functionality.

Finally, you can build your own web-based weighted raster overlay service to support suitability modeling in GeoPlanner!

Contributed by John Preysner, intern with the GeoPlanner team, 2015

more
0 1 2,197
66 Subscribers