- Home
- :
- All Communities
- :
- Products
- :
- ArcGIS Enterprise
- :
- ArcGIS Enterprise Questions
- :
- Re: Geoprocessing Service Runs But Doesn't Produce...
- Subscribe to RSS Feed
- Mark Topic as New
- Mark Topic as Read
- Float this Topic for Current User
- Bookmark
- Subscribe
- Mute
- Printer Friendly Page
Geoprocessing Service Runs But Doesn't Produce Output
- Mark as New
- Bookmark
- Subscribe
- Mute
- Subscribe to RSS Feed
- Permalink
So I've created a geoprocessing Python script tool that I've published as a GP service. This script takes lat/lon coordinates, extracts data from a raster from these coordinates, outputs a .csv and creates an Excel chart from a .vbs script. I can run the Python script on our server from the "C:\arcgisserver\directories\arcgissystem\arcgisinput" path and it works. I'm trying to test the GP service (Execute Task (GET)) from a browser on our REST services page. It says it's successful, but it doesn't actually output the chart. It does create the .csv, but it doesn't run the .vbs script. Here is the result message:
{
"results": [],
"messages": [
{
"type": "esriJobMessageTypeInformative",
"description": "Executing (ChartTest): ChartTest 45 -122 Portland"
},
{
"type": "esriJobMessageTypeInformative",
"description": "Start Time: Wed Jan 25 13:51:23 2017"
},
{
"type": "esriJobMessageTypeInformative",
"description": "Executing (ChartTest): ChartTest 45 -122 Portland"
},
{
"type": "esriJobMessageTypeInformative",
"description": "Start Time: Wed Jan 25 13:51:23 2017"
},
{
"type": "esriJobMessageTypeInformative",
"description": "Running script ChartTest..."
},
{
"type": "esriJobMessageTypeInformative",
"description": "Completed script ChartTest..."
},
{
"type": "esriJobMessageTypeInformative",
"description": "Succeeded at Wed Jan 25 13:51:23 2017 (Elapsed Time: 0.70 seconds)"
},
{
"type": "esriJobMessageTypeInformative",
"description": "Succeeded at Wed Jan 25 13:51:23 2017 (Elapsed Time: 0.71 seconds)"
}
]
}I had a lot of trouble publishing this GP service because the Python script creates a .vbs, and these types of scripts can't be copied to the server. I got around this by changing the ".vbs" reference to ".txt" and publishing. I changed it back to ".vbs" on the server. I'm not sure if the server is blocking the .vbs or what. There are no errors in the server logs.
Solved! Go to Solution.
- Mark as New
- Bookmark
- Subscribe
- Mute
- Subscribe to RSS Feed
- Permalink
The ArcGIS server is on a virtual machine on our Windows server. I'm running the Python script in that environment. That local path does exist, and files keep getting put in there for some reason.
I removed the try/except block and got this error on the REST page
Unable to complete operation.
Error executing tool. ChartTest Job ID: j612726efe3da4a978e95f93ec373186c : Traceback (most recent call last): File "C:\arcgisserver\directories\arcgissystem\arcgisinput\Chart_Test.GPServer\extracted\v101\website_test\Create_CFS_Charts_From_Rasters_NEW_v2.py", line 595, in <module> build_spreadsheet_for_charts(raster_station_data_dict,chartfolder,custom_suffix,daily_analysis_tablename,data_source) File "C:\arcgisserver\directories\arcgissystem\arcgisinput\Chart_Test.GPServer\extracted\v101\website_test\Create_CFS_Charts_From_Rasters_NEW_v2.py", line 280, in build_spreadsheet_for_charts Excel = xlApp.Workbooks.Open(spreadsheet_template_filepath) File "<COMObject <unknown>>", line 8, in Open com_error: (-2147352567, 'Exception occurred.', (0, u'Microsoft Excel', u"Sorry, we couldn't find C:\\arcgisserver\\directories\\arcgisjobs\\chart_test_gpserver\\j612726efe3da4a978e95f93ec373186c\\scratch\\CFS_Monthly_chart_template.xlsm. Is it possible it was moved, renamed or deleted?", u'xlmain11.chm', 0, -2146827284), None) Failed to execute (ChartTest). Failed to execute (ChartTest).
I changed the path of the Excel template from the scratchFolder to one of the g_ESRI_variable paths in the packageWorkspace. I ran the execute task and the Excel file was locked when I tried to open it. I got this message, even though Excel was not open in my task manager.
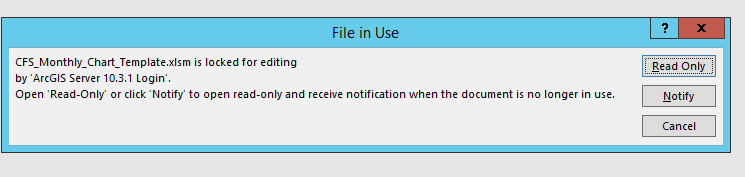
I waited a while and ran the execute task again. I got this error
Unable to complete operation.
Error executing tool. ChartTest Job ID: j5f0ca0d7e80b46b8833ddcb5ad1f1e30 : Traceback (most recent call last): File "C:\arcgisserver\directories\arcgissystem\arcgisinput\Chart_Test.GPServer\extracted\v101\website_test\Create_CFS_Charts_From_Rasters_NEW_v2.py", line 595, in <module> build_spreadsheet_for_charts(raster_station_data_dict,chartfolder,custom_suffix,daily_analysis_tablename,data_source) File "C:\arcgisserver\directories\arcgissystem\arcgisinput\Chart_Test.GPServer\extracted\v101\website_test\Create_CFS_Charts_From_Rasters_NEW_v2.py", line 280, in build_spreadsheet_for_charts Excel = xlApp.Workbooks.Open(spreadsheet_template_filepath) File "C:\Python27\ArcGISx6410.3\Lib\site-packages\win32com\client\dynamic.py", line 527, in __getattr__ raise AttributeError("%s.%s" % (self._username_, attr)) AttributeError: Excel.Application.Workbooks Failed to execute (ChartTest). Failed to execute (ChartTest).
- Mark as New
- Bookmark
- Subscribe
- Mute
- Subscribe to RSS Feed
- Permalink
I see, and it's a single machine site?
So the traceback error is that it can't find the Excel template file, spreadsheet_template_filepath. Does line 24:
Excel = xlApp.Workbooks.Open(spreadsheet_template_filepath)create the template file? Or is it opening an existing file? If it's opening an existing file, that's set to the scratch workspace on line 14:
spreadsheet_template_filepath = os.path.join(arcpy.env.scratchFolder,"CFS_Monthly_chart_template.xlsm")
An existing template file won't exist in a newly created scratchFolder, so you'll need to reference the existing template file in it's original location. Any new output data should be created in the scratch folder using the os.path.join function to combine the arcpy.env.scratchFolder environment variable with the output file name.
- Mark as New
- Bookmark
- Subscribe
- Mute
- Subscribe to RSS Feed
- Permalink
Yes, it's a single machine site.
Excel = xlApp.Workbooks.Open(spreadsheet_template_filepath)References an existing template, so I moved it to:
g_ESRI_variable_6 = os.path.join(arcpy.env.packageWorkspace,u'test_scripts')
spreadsheet_template_filepath = g_ESRI_variable_6 + "\\CFS_Monthly_chart_template.xlsm"That's when I started getting the error that it failed trying to open the Excel template.
- Mark as New
- Bookmark
- Subscribe
- Mute
- Subscribe to RSS Feed
- Permalink
I see, are you running the 64 bit version of Idle included with the Server install, or the 32 bit version, if ArcMap is on the machine as well?
- Mark as New
- Bookmark
- Subscribe
- Mute
- Subscribe to RSS Feed
- Permalink
Only Server is installed on this machine.
We've been implementing matplotlib because we have been having so much trouble with trying to run Excel from the server. It seems like it will simplify things.
I just published a new script tool that does much the same thing as the previous tool, extracts data from a raster and creates a chart based on those values with matplotlib. It worked perfectly through ArcMap on a Workstation on our network. However, I'm having the exact same problem as before. When I click submit job on the REST page, it fails. When I run it in IDLE I get:
RuntimeError: ERROR 000732: Input Raster: Dataset C:\Users\ADMINI~1.MET\AppData\Local\Temp\3\_current_fcst\high_plus.tif does not exist or is not supported.
There is obviously something amiss in our system here. There are only two paths in this script that are in the server folders. These contain all the rasters we're extracting data from.
g_ESRI_variable_1 = os.path.join(arcpy.env.packageWorkspace,u'..\\cd\\raster_data\\world_elev_m_1km_with_1dd_buffer.tif')
g_ESRI_variable_2 = os.path.join(arcpy.env.packageWorkspace,u'_current_fcst')
- Mark as New
- Bookmark
- Subscribe
- Mute
- Subscribe to RSS Feed
- Permalink
Hm, you may need to contact Support so they can dig a bit deeper on this, as I'm not sure why the arcpy.env.packageWorkspace is corresponding to a temp location. What do your Server directories look like? Are they all set to C:\arcgisserver\<directory_name> or something similar?
- Mark as New
- Bookmark
- Subscribe
- Mute
- Subscribe to RSS Feed
- Permalink
Yeah, they're just the default locations set up by the Server:
| Type | Location | |
|---|---|---|
| Cache | C:\arcgisserver\directories\arcgiscache | |
| Jobs | C:\arcgisserver\directories\arcgisjobs | |
| Output | C:\arcgisserver\directories\arcgisoutput | |
| System | C:\arcgisserver\directories\arcgissystem |
I think the problem might be that we log into the VM where the ArcGIS server lives as "Administrator" and the ArcGIS server is on our domain as "EsriUser@Domain." But I'm not sure that should matter if I'm trying to run the task from the REST services page on the web. It's failing there as well.
- Mark as New
- Bookmark
- Subscribe
- Mute
- Subscribe to RSS Feed
- Permalink
When you run the GP service from Rest it's running on the Server machine as the user that runs the ArcGIS Server Windows service, so as that "EsriUser@Domain" account. When you've run it successfully outside of ArcGIS Server, you've been using your Administraotr account? Can you log onto the machine as the "EsriUser@Domain" account, (whatever account is running ArcGIS Server), and run it through IDLE using that account? You can also run Idle as that user if the account can't remote into the machine itself. I've really never seen a situation where the script runs outside of a GP service but as a GP service, it fails, (granted it's run as the same user in both situations).
- Mark as New
- Bookmark
- Subscribe
- Mute
- Subscribe to RSS Feed
- Permalink
We'll need to add the EsriUser to remote login.
Meanwhile, I changed the two paths in the new matplotlib GP tool script to be local on the C:/ drive. We remembered that the previous script was creating a .csv on the local drive from the REST page online when the paths were all local. I've added this new GP service to a map document and put it on our web server. When I click on the GP tool , it hangs on "calculating" for a few minutes and then I see this error in the developer tools console. I set the maximum times in the service pooling to 10 minutes.
undefined
log
:
undefined
message
:
"Timeout exceeded"
response
:
Object
responseText
:
undefined
stack
:
"Error: Timeout exceeded↵ at n [as constructor] (http://js.arcgis.com/3.19/init.js:111:353)↵ at new n (http://js.arcgis.com/3.19/init.js:111:456)↵ at l (http://js.arcgis.com/3.19/init.js:132:388)"
status
:
undefined
xhr
:
XMLHttpRequest
__proto__
:
n- Mark as New
- Bookmark
- Subscribe
- Mute
- Subscribe to RSS Feed
- Permalink
Just figured it out. It was getting hung up on "plt.show()" in the matplotlib script. It works on the REST page now.