Turn on suggestions
Auto-suggest helps you quickly narrow down your search results by suggesting possible matches as you type.
Cancel
- Home
- :
- All Communities
- :
- Products
- :
- ArcGIS Enterprise
- :
- ArcGIS Enterprise Portal Questions
- :
- line symbol with hash
Options
- Subscribe to RSS Feed
- Mark Topic as New
- Mark Topic as Read
- Float this Topic for Current User
- Bookmark
- Subscribe
- Mute
- Printer Friendly Page
line symbol with hash
Subscribe
4942
5
10-07-2013 09:58 PM
10-07-2013
09:58 PM
- Mark as New
- Bookmark
- Subscribe
- Mute
- Subscribe to RSS Feed
- Permalink
Is there a way to create a line symbol with the number of hash represented by a number field? I am trying to represent the feet of head loss in pipe segments (regardless of length) with hash marks. I want the number of hash marks equal to the feet of head loss. For example, a pipe with a 2-foot head loss would be always drawn somewhat like this: ----+----+--- ; that is, a line with 2 hash marks.
Thanks.
Thanks.
5 Replies
10-08-2013
04:32 AM
- Mark as New
- Bookmark
- Subscribe
- Mute
- Subscribe to RSS Feed
- Permalink
If you can't come up with a different solution you might want to create a new point layer and then use, Create Random Points along your lines using, a field in your line layer that identifies how many points there need to be?
Another place to look might be working with representations?
Another place to look might be working with representations?
10-08-2013
06:37 AM
- Mark as New
- Bookmark
- Subscribe
- Mute
- Subscribe to RSS Feed
- Permalink
Unfortunately, I only have the basic license and cannot create random points or representations.
Is there a symbology feature that is dependent on an attribute value? Somewhat similar to a the rotation angle of a label that can be dependent on the value of an attribute.
Is there a symbology feature that is dependent on an attribute value? Somewhat similar to a the rotation angle of a label that can be dependent on the value of an attribute.
10-14-2013
12:31 PM
- Mark as New
- Bookmark
- Subscribe
- Mute
- Subscribe to RSS Feed
- Permalink
First take a point feature and create a symbol for it using a character. such as the number 2. Save As the symbol in your system.
Then go to your line feature.
Select a the dashed line symbol you want, with out the tags, just a dashed line symbol.
Click on Edit Symbol
click the plus button to add a layer
From the drop down change the symbol type to Marker Line Symbol.
Click on symbol and choose your number 2
Click on Template and move the slider bar over so you have 3 or 4 positions showing.
Click in all the white boxes and make them black.
That will create the dashed line symbol with the number 2 interspersed along it.
Is there a way to create a line symbol with the number of hash represented by a number field? I am trying to represent the feet of head loss in pipe segments (regardless of length) with hash marks. I want the number of hash marks equal to the feet of head loss. For example, a pipe with a 2-foot head loss would be always drawn somewhat like this: ----+----+--- ; that is, a line with 2 hash marks.
Thanks.
10-14-2013
03:02 PM
- Mark as New
- Bookmark
- Subscribe
- Mute
- Subscribe to RSS Feed
- Permalink
Thanks rborchert. I tried your suggestion and it partly works; that is, I still cannot show what I intend to show. Let me explain a little more. Say I have a line shapefile with 3 records and a field call "Loss". Record1 has 2 in Loss; Record2 has 6 in Loss; and Record 3 has 1 in Loss.
I am looking for a symbology that would show the lines like a the simple railroad symbol, but with the number of ties (hash) dependent on the value of the field Loss, regardless of the length of the line or the scale of the display. So the line representing Record1 should be a line 2 hash marks evenly distributed along its whole length ---+-----+---; Record2 should be a line with 6 hash marks evenly distributed along its length -+--+--+--+--+--+-; Record3 should be a line with 1 hash mark in the middle ------+------.
The software (running in ArcGIS) generating the value for Loss can be temporal; that is, give hourly results for the whole duration of the simulation. The value of Loss at every hour is different. The software can skip to any hour and dynamically change the value of Loss.
Is it possible to make a symbol for a line with the number of "decorations" (ties, hash, etc.) dependent on a field/attribute value?
Thanks for you help and patience. And to everyone giving me pointers.
10-15-2013
07:35 AM
- Mark as New
- Bookmark
- Subscribe
- Mute
- Subscribe to RSS Feed
- Permalink
Oh now I see what you want. First make your basic symbols based on the attribute that gives you the numbers you want.
For this example I will use the value of 2
double click the 2 to open the symbol selector. Select Railroad then click edit symbol
you should have 2 symbol levels. a hash and and an unbroken line.
Select the hash and copy paste it as a new level and change the angle to zero.
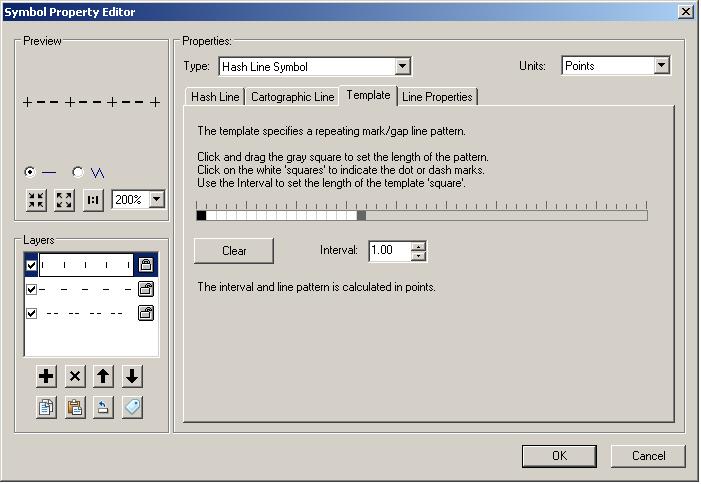
Now on the first hash select the template tab and make it look like Image1. then do the same for the second hash.
Now go to the template for the unbroken line. Make its template look like image 2
Using the Template you can specify exactly how the line is broken. For the values of 3 simply Expand the gray box that is at the end of the template line another 5 values to the right. After the last set of black squares leave the first 2 white and the next 3 black. Now expand the hash mark templates to the right 5 more values. You will now have a line with 3 dashes between the plus symbols. do the same for 4 or 5 or more, etc...
For this example I will use the value of 2
double click the 2 to open the symbol selector. Select Railroad then click edit symbol
you should have 2 symbol levels. a hash and and an unbroken line.
Select the hash and copy paste it as a new level and change the angle to zero.
Now on the first hash select the template tab and make it look like Image1. then do the same for the second hash.
Now go to the template for the unbroken line. Make its template look like image 2
Using the Template you can specify exactly how the line is broken. For the values of 3 simply Expand the gray box that is at the end of the template line another 5 values to the right. After the last set of black squares leave the first 2 white and the next 3 black. Now expand the hash mark templates to the right 5 more values. You will now have a line with 3 dashes between the plus symbols. do the same for 4 or 5 or more, etc...