Turn on suggestions
Auto-suggest helps you quickly narrow down your search results by suggesting possible matches as you type.
Cancel
- Home
- :
- All Communities
- :
- Products
- :
- ArcGIS Enterprise
- :
- ArcGIS Enterprise Portal Questions
- :
- Help: Create magnifier-like annotation in map desi...
Options
- Subscribe to RSS Feed
- Mark Topic as New
- Mark Topic as Read
- Float this Topic for Current User
- Bookmark
- Subscribe
- Mute
- Printer Friendly Page
Help: Create magnifier-like annotation in map design
Subscribe
2695
2
05-23-2013 12:46 AM
05-23-2013
12:46 AM
- Mark as New
- Bookmark
- Subscribe
- Mute
- Subscribe to RSS Feed
- Permalink
Dear all,
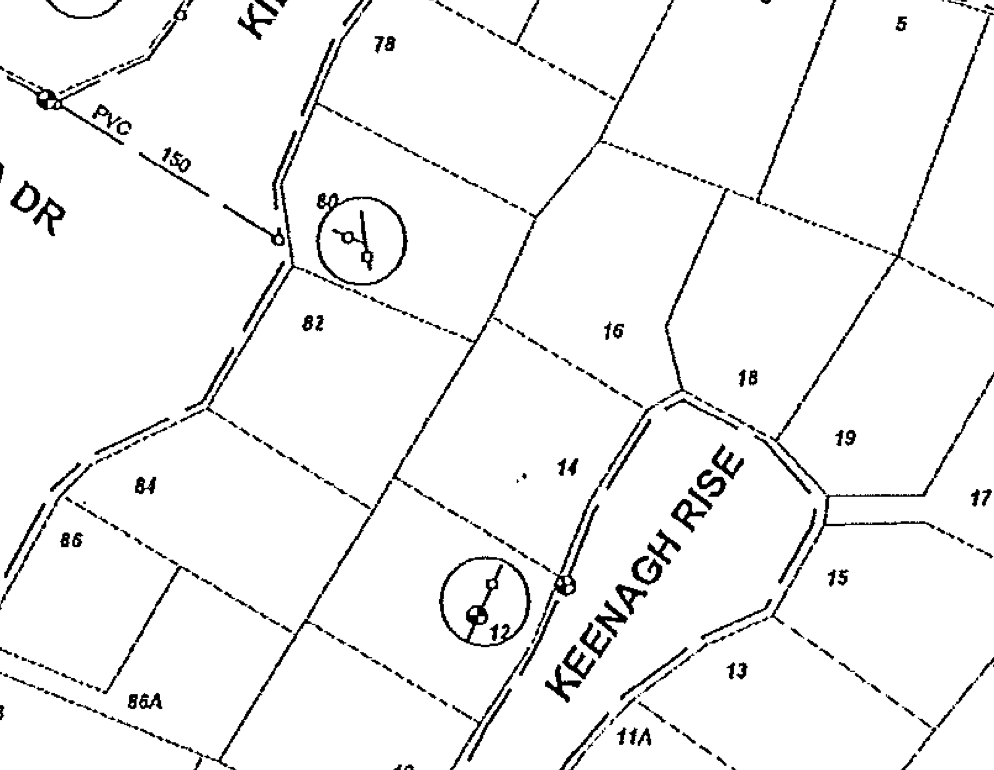
Briefly explain the situation: I want to produce a water hydrant & valve map book at 1:2000 scale. It is a data driven page map of over 100 pages. The problem is at this scale, there are cases that hydrant and valve are too close. So I need a magnifier-like annotation embedded in the map page to show details at a larger scale e.g. 1:500. What I want to achieve is something like this:
[ATTACH=CONFIG]24610[/ATTACH]
Does anyone here happen to know how to do this on ArcGIS desktop. I tired search in here as well as on Google, no luck. I have got 10.1 editor.
Thanks heaps in advance!
-Hua
2 Replies
05-23-2013
09:23 AM
- Mark as New
- Bookmark
- Subscribe
- Mute
- Subscribe to RSS Feed
- Permalink
The first thing I think of is an inset. Configure it to also use data driven pages How you synchronize them is for you to figure out, as I haven't done it. Perhaps an additional field in the index layer, or a different index layer all together that has the same name field for identification, but different feature extents to set your inset extent.
Regards,
Jim
Regards,
Jim
05-28-2013
08:17 AM
- Mark as New
- Bookmark
- Subscribe
- Mute
- Subscribe to RSS Feed
- Permalink
Hua,
Managing our Public Works utilities I have gone down this road a little bit myself and as a result I have struggled with the same clutter issues. In a nut shell, if two water mains intersect with a tee & four valves, the valve are only 4 or 5 feet apart, at 1�?�=200�?? scale you have one valve not four, for our field crews to trust the maps they need to be able to see all of the information.
A big obstacle each organization has to overcome in their own way is deciding whether they are going to map their utilities at their real world location or map them schematicly. Mapping for schematic purposes is placing symbols based on clarity at the scale of their paper map book pages, even if they end up 15' away from their real world location. In my organization we have mapped our utilities at their real world locations believing that in the future tablets will be so common that everyone will be able to zoom in on a digital map wherever they are and paper books will go away. Also for our engineers in the office, they don�??t use the paper maps anymore they instead enjoy the accuracy of the information they can find in our electronic maps.
Here is a link to a thread (http://forums.arcgis.com/threads/9312-Water-and-Waste-Water-Symbols) with a very good dialogue between several users working through the same issue you are in. In the thread Tomsriv uploaded an attachment that shows he achieved the insets you are wanting, and in my opinion his example map book page is both beautiful and packed with information. However, insets were achieved by having a separate utility feature dataset for the insets. The features in these insets are a duplicate of the actual mapped data drawn for schematic clarity (essentially maintaining two sets of identical data drawn to different scales). This duplicate magnified data lives in the map/data view, not in the paper space/layout view. In the "real world" the magnified data is drawn at a location that is empty of information and close enough to the detailed area to be visually connected.
The reason for creating a separate feature dataset and drawing the features in the data view is because at this time it is not possible to have the data driven pages cycle through both the page grid and an inset grid; even if it were possible for data driven pages to cycle through both the page grid and inset grid then you would still have to make the insets relocate for each page so they don�??t cover up relevant information. This is a lot to ask of ArcGIS and this is why all Tomsriv�??s insets are drawn in the data view.
If your organization is really pushing for magnified inset views, you may try to adjust the layout of your paper space/layout view to create fixed boxes where the insets can live along the edge of the page (this would eliminate the issue of them having to move with the different pages). I'm not certain if data driven pages can track two different grids. The hard part about this would be if you have a page with more than one inset then you would need more inset boxes, while on a page with no insets these boxes would all be blank. The loss of page real estate would likely make this impractical.
I hope this helps, post back with any questions as you work through this issue.