Turn on suggestions
Auto-suggest helps you quickly narrow down your search results by suggesting possible matches as you type.
Cancel
- Home
- :
- All Communities
- :
- Products
- :
- ArcGIS Enterprise
- :
- ArcGIS Enterprise Portal Questions
- :
- Creating new XY data within a plot from UTM coordi...
Options
- Subscribe to RSS Feed
- Mark Topic as New
- Mark Topic as Read
- Float this Topic for Current User
- Bookmark
- Subscribe
- Mute
- Printer Friendly Page
Creating new XY data within a plot from UTM coordinates
Subscribe
1869
4
01-18-2012 06:08 AM
01-18-2012
06:08 AM
- Mark as New
- Bookmark
- Subscribe
- Mute
- Subscribe to RSS Feed
- Permalink
Hello,
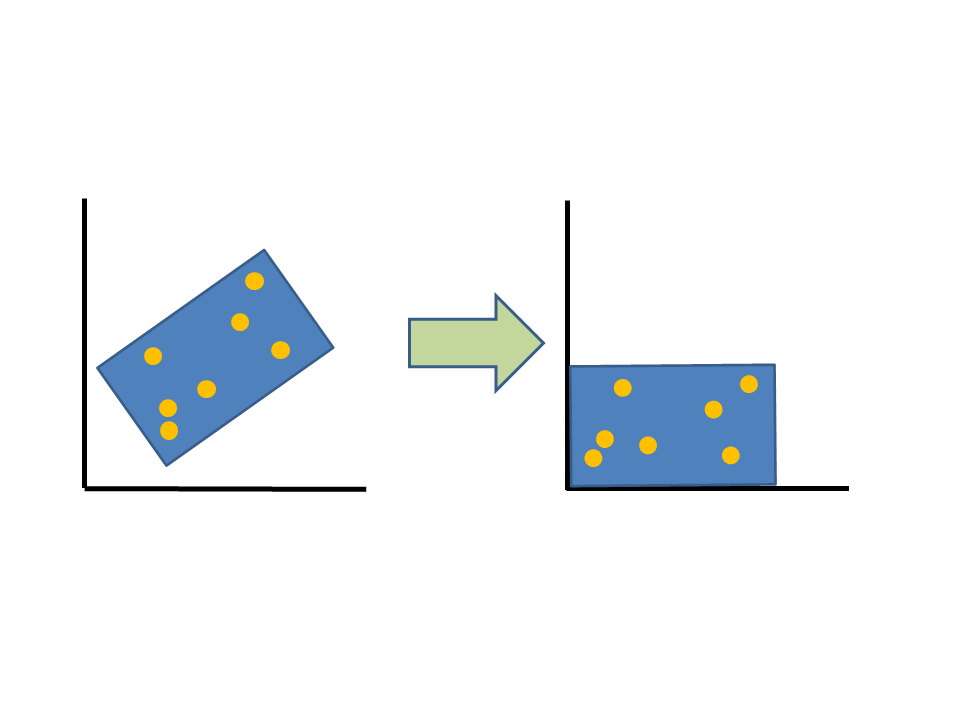
I have several rectangular plots (shapefiles) in which I have several points (shapefiles). I have the XY data (UTM) for the points. I understand that UTM data is XY, but I would like to know the point locations within the plot ("the plot's XY"). For example, one of the plot's corners would become the new origin for my "PLOT XY." Can this be done in ArcMap? And if not, what should I be reading about / searching for to complete this operation?
Thank you kindly,
Mike
4 Replies
01-18-2012
07:01 AM
- Mark as New
- Bookmark
- Subscribe
- Mute
- Subscribe to RSS Feed
- Permalink
My suggestion would be this:
1. Create a new point shapefile, add it to the map and create a point at the maps origin
2. Add data to bring your rectangle and point shapefiles
3. Start an edit session and then select your rectangle and points so that they are all selected at once
4. Drag the corner of your rectangle that you want to be at the maps origin and snap it to the point created in step 1
5. Save edits
6. Create 2 new fields in your point shapefile as short, called ColumnX and ColumnY or something like that
7. Right click on the column and calculate geometry for X and Y based on which every projection you desire (the shapefiles projection or the dataframes projection)
01-20-2012
09:27 AM
- Mark as New
- Bookmark
- Subscribe
- Mute
- Subscribe to RSS Feed
- Permalink
Thank you for the quick reply. Attempting the procedure now.
Cheers,
Michael
Cheers,
Michael
01-20-2012
10:23 AM
- Mark as New
- Bookmark
- Subscribe
- Mute
- Subscribe to RSS Feed
- Permalink
Hello,
Unfortunately you can't rotate point shapefiles in editor. Thanks for the suggestion.
Cheers,
Mike
Unfortunately you can't rotate point shapefiles in editor. Thanks for the suggestion.
Cheers,
Mike
01-20-2012
11:31 AM
- Mark as New
- Bookmark
- Subscribe
- Mute
- Subscribe to RSS Feed
- Permalink
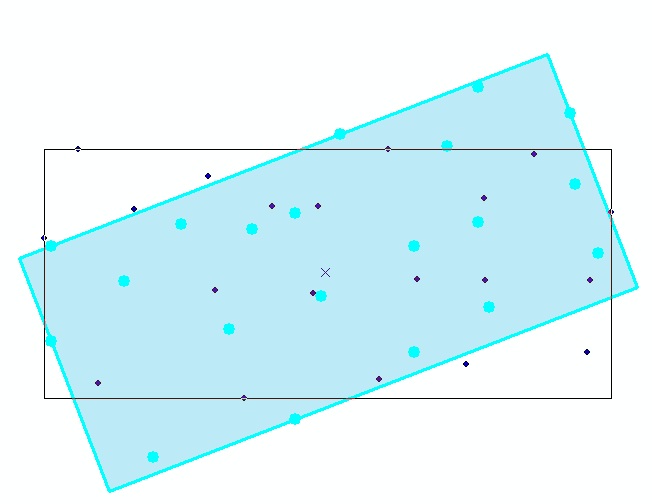
1.) Create Minimum Boundary Geometry, rectangle by width or area (may be different), and place in the same geodatabase as your points
2.) Start editing your points
3.) Select all of the points you want to rotate
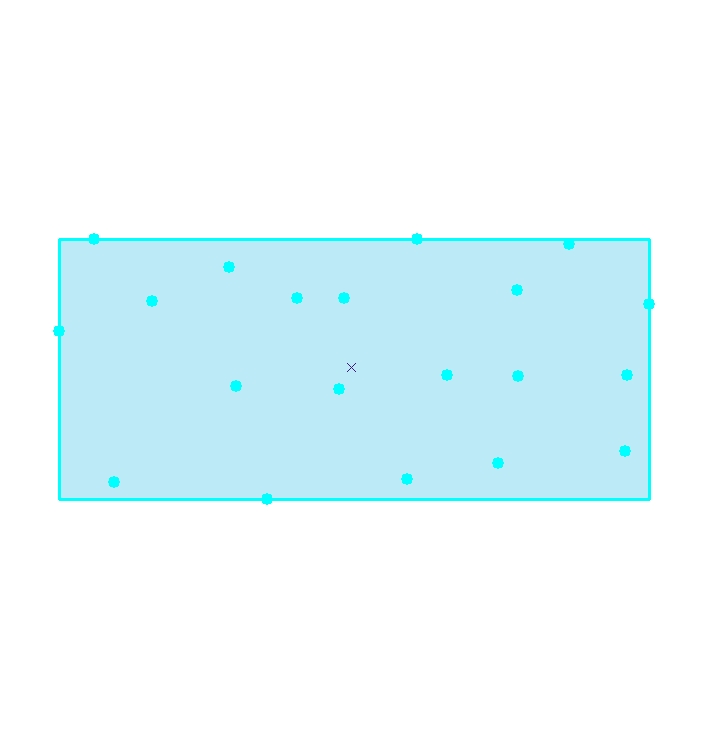
4.) Use the Rotate tool to rotate the selection (I think you'll have to eyeball when it gets horizontal)
2.) Start editing your points
3.) Select all of the points you want to rotate
4.) Use the Rotate tool to rotate the selection (I think you'll have to eyeball when it gets horizontal)