Select to view content in your preferred language

Bruce Harold's Concave Hull Estimator Tool Enhanced

16506
36
06-11-2015 09:43 AM
RichardFairhurst
MVP Honored Contributor
5 36 16.5K

Several discussions in the old forum referenced the Concave Hull Estimator script tool by esri's Bruce Harold, but during the conversion and website migrations all of the links to that tool were broken.  I had made an enhanced version of the tool which I have attached.  The bulk of the code is by Bruce, but the code that allows a user to select a case field was added by me.  The case field creates selection sets of points for processing based on the case field values without having to manually create each set and run the tool separately for each.

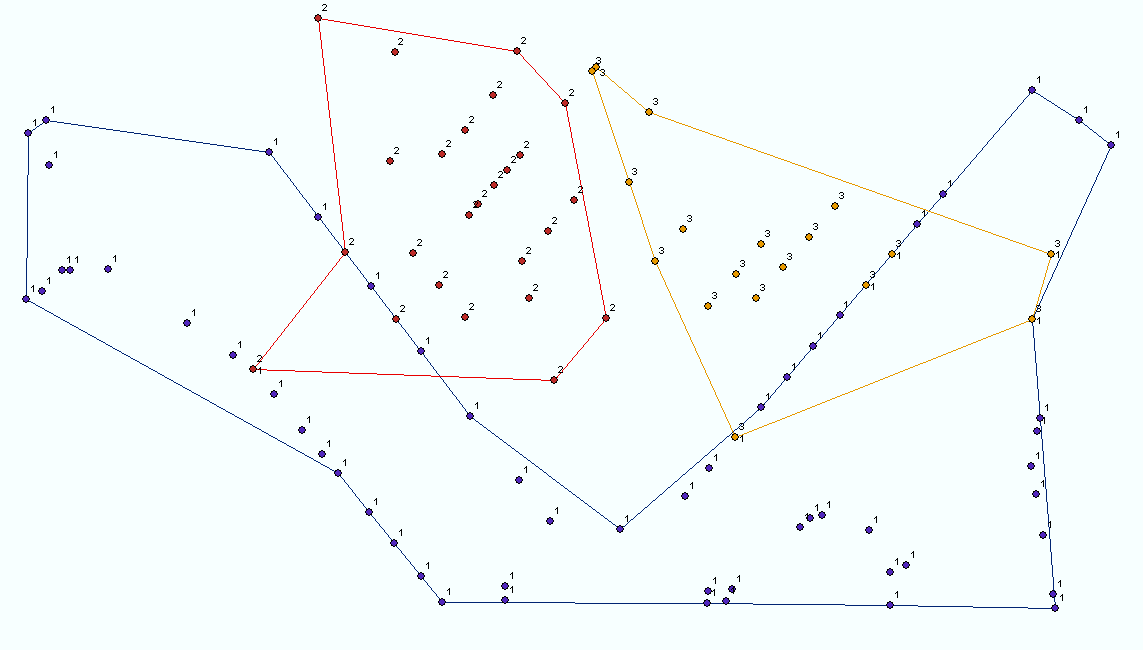
An example output of the tool is shown below (I don't recall the k factor I used).  All of the hulls were created using a case field number as shown.

ConcaveHull2Result.PNG

Anyway, while the real credit for this tool belongs to Bruce, his original post has been referenced recently on several websites with each commenting that it the link has been lost.  I wanted to revive the link to a version of that tool (with my own contribution thrown in).  Interestingly, this tool included the use of a dictionary before I understood anything about what dictionaries did.

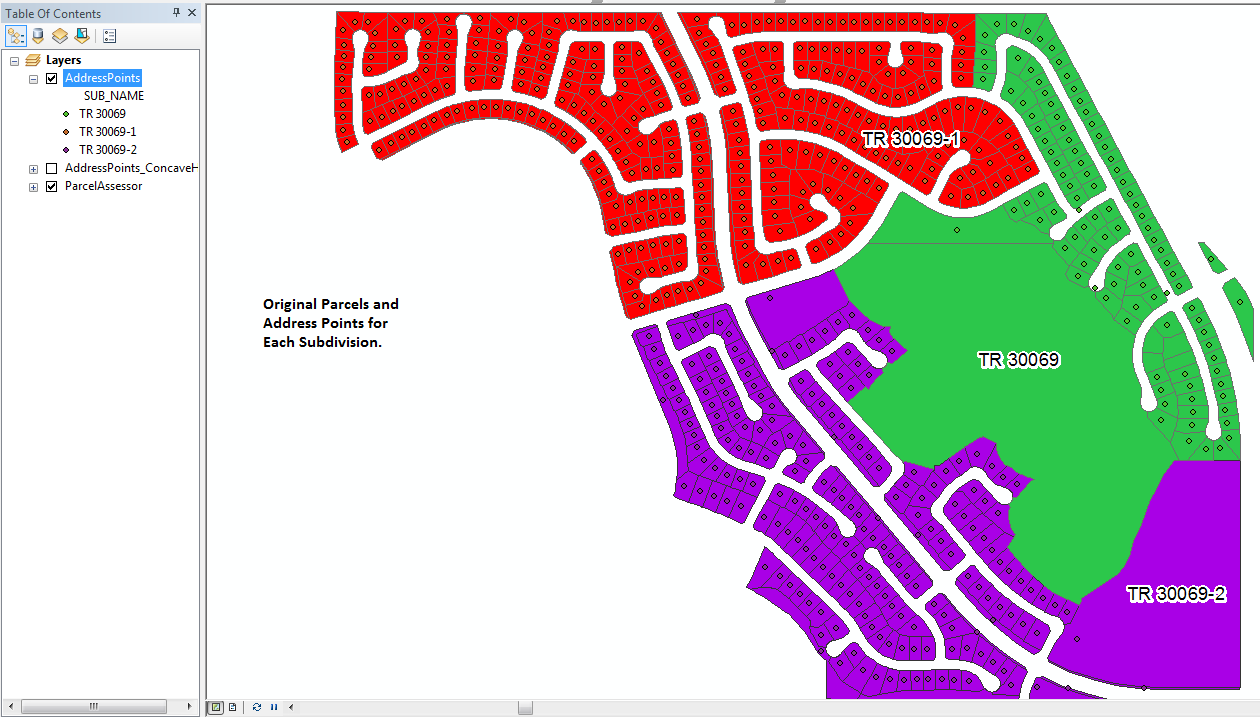
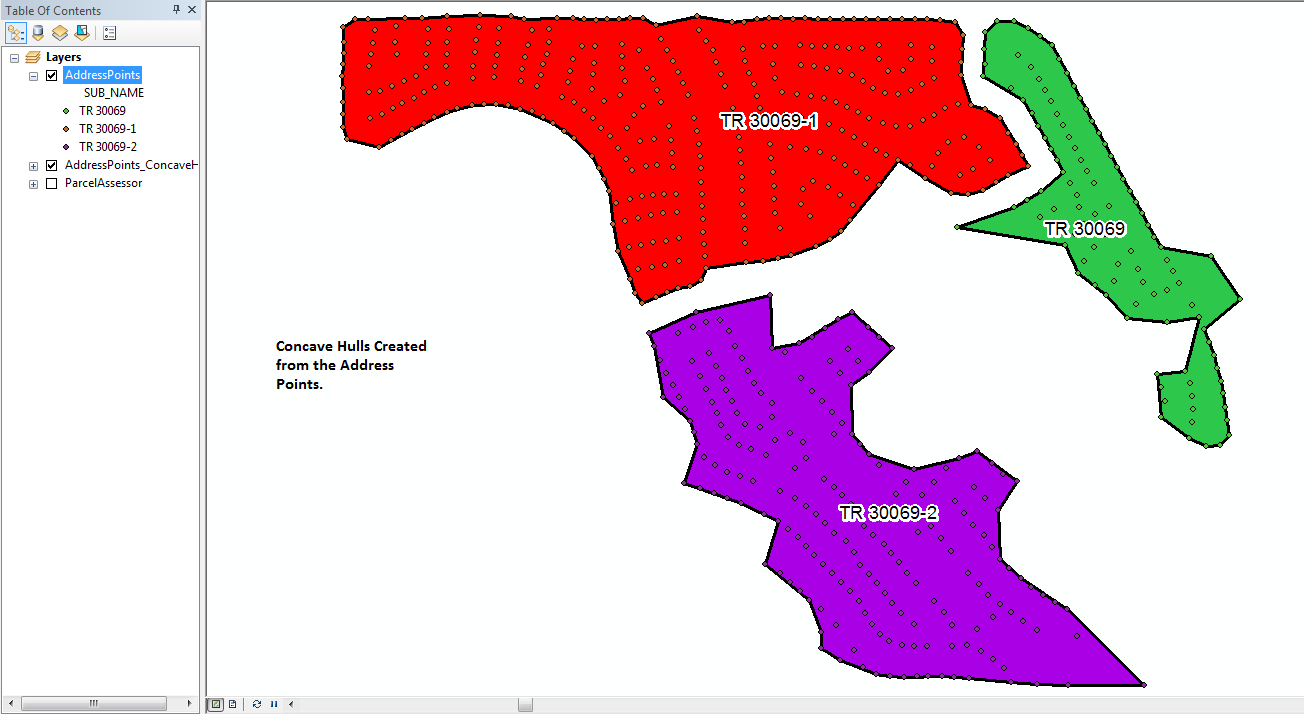
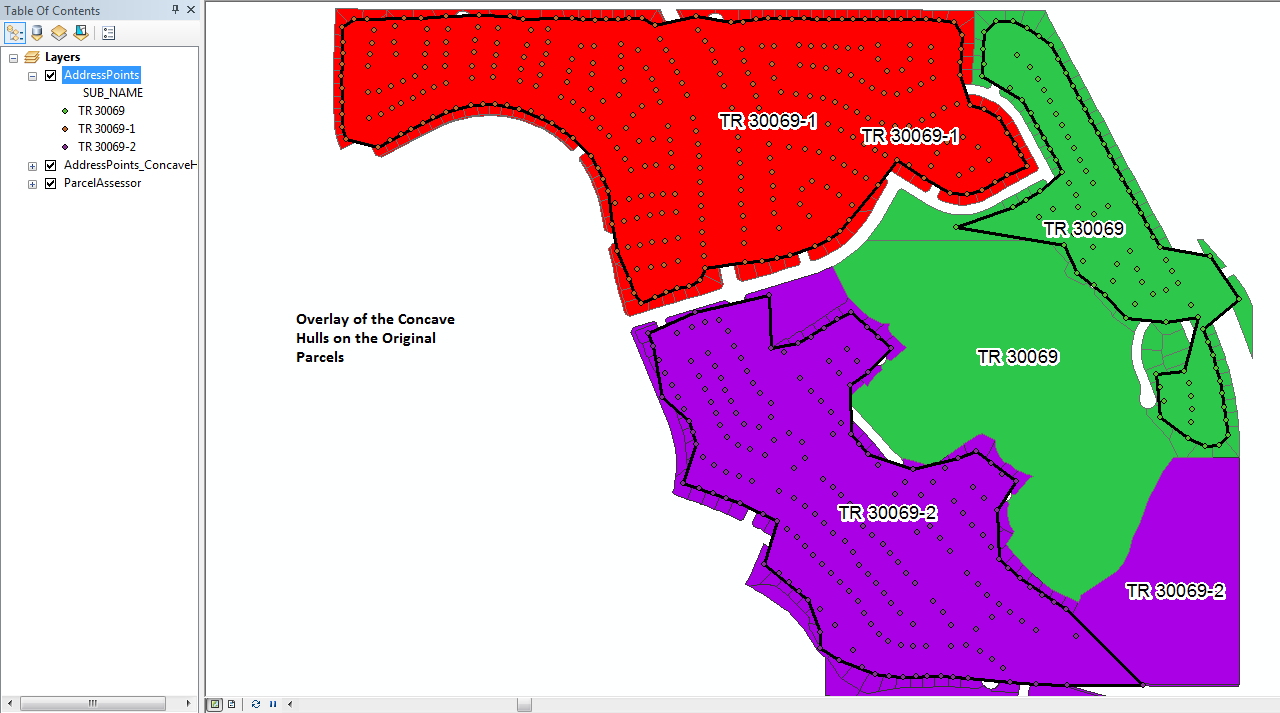
Here are pictures I just processed on a set of address points for three Subdivisions. For comparison the original parcels are shown. The starting k factor for this tool run was set to 3, but the tool iterated each point set to at least a k factor of 6 before creating each polygon (a k factor of 9 was used for one of them). The tool created the new hull feature class and all 3 hulls in under 35 seconds.  The presence of somewhat regularly distributed points that fill the interior of the hull helps to create a more accurate hull outline than just using the set of points that ought to define the outline.

Hull 1 Original Parcels.png

Hull 2 Concave Hulls.png

Hull 3 Overlay of Hulls on Parcels.png

36 Comments
BruceHarold
Esri Regular Contributor

Thanks Richard!

If people have Desktop Advanced there is also the Aggregate Points tool in the cartography generalization toolset, but which doesn't support a case field, or the HullAccumulator transformer in Data Interoperability's Workbench application, which does support a group-by (or case) item.

Regards

WallyKempf
New Contributor II

Is a particular ArcGIS level of licensing needed to run this (like Advanced)?  I tried to run as is, but it rejected. I'm not sure if it was because the script needs to be modified or if I have a license restriction issue. Otherwise, it looks like it would do exactly what I've been searching for, for years.

RichardFairhurst
MVP Honored Contributor

Very few tools are used in the script (MakeFeatureLayer_management, CreateFeatureclass_management, and AddField_management are the only tools I see being used) and all the tools used are available under a Basic license.  All the rest of the code uses pretty standard arcpy geometry, array, cursor and dictionary processing,  So unless the error message mentioned something about a license I doubt that is the issue.  What error message appeared when the tool was rejected?

What version of ArcGIS are you using?  The toolbox probably is only compatible with ArcGIS 10.2 or above, since that is the version I used to build it.  In fact I need to update the code to use the 10.1 version cursors to improve the speed of the tool, since it uses the outdated 10.0 version cursors that are very slow.  But that means the core code would work if you only have 10.0.  You might have to rebuilt the toolbox interface to make it work with an earlier version.  Here is a screen shot of what the tool interface should look like when it opens properly:

WallyKempf
New Contributor II

Richard- I appreciate your time and hoping not to become a burden. After your message below, I realized that I was running improperly as a script instead of a tool as I initially wasn’t getting the popup window as shown in your screen shot. Anyway, I got past that, but I’m still having trouble. I think I’m really close to making this work, but still “so far”. Attached are screen shots of the settings that I used and then the error. The program I use is RouteSmart, which has ArcGIS 10.2.2 as the engine. What I’m hoping to accomplish is to programmatically draw the polygon around each set of colored “dots” which is categorized on a field called Demand_6, which is the route number.

Wally Kempf

Routing Specialist

Progressive Waste Solutions, USA & Canada

219.405.5688

IanMurray
Frequent Contributor

Wally Kempf​, you didn't post any attachment.  Might want to try again.

WallyKempf
New Contributor II

RichardFairhurst
MVP Honored Contributor

Wally:

Please open the tool and screen shot the settings you are entering before you run it.  Also, what type of field is the Demand_6 field?  I am guessing a Long based on the screen shot, but I want to confirm that.

You could manually select a set of points for just one value in the Demand_6 field and try running the tool without a Case field to see if it can create any output.  That way I may be able to more easily tell what part of the code is failing.

If no obvious problem becomes apparent from those two actions then to trouble shoot this you will probably need to modify the code by adding some arcpy.AddMessage() lines to output a message when different parts of the code are completed to see how far the code gets before it fails.  Once I know where the code is failing then hopefully I can identify a solution.

WallyKempf
New Contributor II

Actually the lower screen shot was before the tool was run and the upper screen shot was the error that resulted. The demand_6 is a “double” and I’ve also tried it on another field called route which is formatted as a string. I will follow your suggestions and let you know the results. Thanks

RichardFairhurst
MVP Honored Contributor

It does not show the right side of the screen shot in Geonet, so I did not see the settings.  I see nothing wrong with your inputs.  Do my second instruction by selecting one set of points for a single Demand_6 value manually and remove Demand_6 from the Case field (leave it blank).  Then run it again and let me know what happened.  You also should try the minimum k setting, since the tool increases the k factor when it needs to automatically.  Several of your sets look like the whole set is not much over 30 points, so a k of 30 is too high when you get to sets with fewer than about 60 points.  I have never used a k factor above 15 and wouldn't unless I had about 200 points minimum for the smallest case value.

WallyKempf
New Contributor II

Yes, I’m running it now on a only one of the sets of points. I started with a k factor of 10 and it wasn’t enough(Hull does not enclose data) as it is now working its way through the numbers, currently at k=17. So at least this much is working properly. I would imagine, in a denser series of service points, the k number could be lower. I will keep you posted and appreciate your help.

RichardFairhurst
MVP Honored Contributor

I ran a test with a k of 15 and a k of 30 on some of my points.  The k factor of 15 did have to increase for several point sets, but overall was used for most sets.  The output of k=15 was good and hugged the points better than a setting of k=30.  So the higher the k factor the more generalization you will get when points spread apart.

I like the k-15 better, but my preference depends on the nature of point data I am using and whether my objective was for a tight outline or a generalized outline.  Below the Red lines outline k=15 and the green fill is k=30 (I ignored the yellow points).  The poly on the upper left failed to enclose all points at k=30, but was fine at k=15.

WallyKempf
New Contributor II

Yes, I like the way your results looked (tighter). I aborted mine as it was up to 18, then re-ran it at 30. It did complete and did a fairly good job, but as you said, it did generalize in some spots. I am going to re-run it starting at 20 to see if it looks better. Then I will have to try running it again, using the all of the points desired (case), hoping that it breaks on the particular field data (demand_6). I can make the field another format, if you want me to try something else for a format.

RichardFairhurst
MVP Honored Contributor

I looked at the code and the case field should work with any field type.  However, I don't think I ever tested the case field code when Null values existed in the case field.  So if there are any points with Null values in Demand_6 field you should exclude them from the input by first selecting the points without Nulls of by using a definition query to exclude the Nulls.

WallyKempf
New Contributor II

Thanks. None of my data has null values in the case field. The current test batch has worked its way from k=20 to k=22 and still going (I know it will be fine at k=30, as that’s been proven). I will then re-try the data with all of the routes turned on in hopes that it successfully complete creating the polygons based on case.

WallyKempf
New Contributor II

Richard- it works now, even with all of the service points displayed and by using the CASE function. The only change I made was I copied the field that I was using for case that was either a string or a double into a new field that was formatted as a short integer. I tested one, then of 2 of them, then finally all of them used the new field for the case and it created all of the boundaries. For some reason, I thought I had to check the box for null values. When left unchecked, the process ran through all the routes. Thank you for your help. This is a really nice tool that I’ve been waiting a long time to discover.

RichardFairhurst
MVP Honored Contributor

You should download the attached toolbox again.  I have just posted a revised version of the code in the original blog post attachment to use da module cursors and to use a dictionary to sort the points by case field value to speed up the reading and writing of the points.  The speed will be noticeably improved when there are a lot of points with a lot of different case values being processed.  The revised toolbox now requires a user to have ArcGIS version 10.1 or higher.

The time the code takes to analyze the points for creating each hull based on a given k factor has not changed.

WallyKempf
New Contributor II

I will do that. Thank you!

ElenaVandebroek
New Contributor

Hi Richard,

Thank you for posting this tool! It's exactly what I'm looking for. However, I'm having trouble getting the tool to run. See the screenshots below for my inputs and outputs. I've tried the tool in ArcMap 10.1 and 10.2.2 (both Basic licenses). I would ideally like to use this tool with a modelbuilder iterator since I have many point shapefiles to analyze. Any idea why I might be getting this error? I am quite new to python.
Thanks!

Nena

concave_hull_inputs.JPGconcave_hull_error.JPG

RichardFairhurst
MVP Honored Contributor

I would add a field called CASE_ID and calculate it all to 1 and set that as the case field, rather than leaving the case field blank.

If that doesn't work, convert the shapeflle to a feature class in a file geodatabase (fgdb) and output to another feature class in the same fgdb.  I don't really test my tools to see if they work with shapefles, since I would argue no one should ever use them for geoprocessing.  I avoid them due to their poor performance and limitations.

RichardFairhurst
MVP Honored Contributor

Elena:

I have updated the script and fixed two bugs that only occur when a shapefile is used as the tool output.  The attached tool should now work when you use a shapefile for either the input or the output.  After you download the attached updated version the tool should work with the settings you were trying in your post.

As far as using the tool with ModelBuilder, that would only work if my tool was the last tool used in your model before iterating the next file.  The tool does not refresh ModelBuilder so that the tool output will be visible to the parameters of a tool you attached to it.  I do not intend to make the tool refresh ModelBuilder.

Iteration can be done in a Python Script.   That is the way I would go if you needed to process the output of my tool through other tools as part of each iteration.

ElenaVandebroek
New Contributor

Hi Bruce,

Thanks for your prompt answer. I applied the new version of the script to

my shapefile, but it took a very long time to run (days, and it's still not

done), so I stopped it. I think I simply have too many points (20K+), so I

will look into other ways to do this. Thanks for your help - I will

definitely use the tool in other applications!

Elena

RichardFairhurst
MVP Honored Contributor

The algorithm is definitely impacted by the number of points it has to compare, so unless you are willing to do some kind of point thinning this tool won't work for that amount of points.  You could manually trace the shape faster than this tool given the number of points you are processing.  I have not tested it for an upper limit, but I would estimate that this tool can only process a maximum of 1,000 points in a reasonable amount of time.

The tool also does not consider or include Z in the line shape it creates, which would add add another level of complexity of the algorithm, so if that is important to you this tool may not work for what you want.

MichaelFletcher1
New Contributor II

Hi Richard, Thanks for posting this tool. I am using it, and I am able to use it easily on a on-time basis but when I try to use it in a python loop I am having trouble. My loop works (calling variables from a list) as I have used it on various other tools. I Receive an error: "

Runtime error  Traceback (most recent call last):   File "<string>", line 9, in <module>   File "Y:\Desktop\ARCGIS\Toolboxes\ConcaveHullByCase\ConcaveHullByCase.tbx", line 82, in ConcaveHull     Z17xTbqLuWUQybYfJO0bSqn5JMZYbcN3yTjgg05tS0LTUVdnpln4gm8Hauuo2W6SymYfaLYg4cH+ ExecuteError: Failed to execute. Parameters are not valid. ERROR 000732: Input Points: Dataset "Amsterdam.shp" does not exist or is not supported Failed to execute (ConcaveHull). 

I have changed the script to remove the .shp. extension and have the same result. I have run the tool on the shape file in arc, without a script and it works fine. I am running my loop script by copying it into a python window in arc, and executing it there, with all of the relevant shape files open in the workspace....

I have many datasets on which I am trying to run your tool and the loop would make things easy....

Thanks 

Michael

Hi Richard, Thanks for your reply. I worked it out this morning - In previous uses of my Loop with other toolboxes, the way to call the variable was slightly different, and I had not made that change so it works fine now. The previous use (select data) was '

plume = "NAME = '" + var + "'" but to loop your file I just needed 'plume = var' so the resulting call line was:

arcpy.ImportToolbox("Y:\Desktop\ARCGIS\Toolboxes\ConcaveHullByCase\ConcaveHullByCase.tbx")

list = ['Amsterdam', 'Bowie'];

for var in list:

plume = var

outpath = outpathbase + var + 'Conc'

arcpy.ConcaveHull(plume,"10",outpath,"#","#")

my full list has 81 variables, and I need to run this on several different datasets, and then repeat several times so your script has saved me  a huge amount of time....... Thanks..

RichardFairhurst
MVP Honored Contributor

Please post your script code so I can test it.  It is impossible to tell whether the code in my tool is at fault or the batch code you have written is at fault for this error without knowing the code you were using.  Are you certain that the Amsterdam.shp input is the actual name of your layer and that the layer is a point shapefile and not a multi-point or some other shape type shapefile?

DataOfficer
Regular Contributor

Hi Richard 

Thanks a lot for posting this tool. I am trying to run this to create a series of range polygons around snake records across the whole of the UK (see below). I'm aware that the data may be too unevenly dispersed to create any enclosing hull - I am just playing around with different tools at the minute to see what works.

Running your script, I keep getting the below error message. I have tried different k values but it always fails at 'line 57'. Do you have any suggestions? Thanks in advance for your help!

My input data set:

RichardFairhurst
MVP Honored Contributor

The error is occurring in a function Bruce wrote that is called multiple times from several methods with a variety of inputs, so I would have to set a bunch of print statements in the code to determine which part of the code is actually running when the error occurs. I would have to have your actual data to troubleshoot this error, since it has never occurred with any data I have used with the tool.   Also you would have to show me the inputs to the tool you are using.

Is your data using a projected coordinate system?  It should be when using this tool.

DataOfficer
Regular Contributor

Hi Richard

Thanks for your reply. Do you have an email address I can send the data to? Do you need this as a .csv file (which is how I initially added the points before exporting them to point shapefiles) or the actual point file used when running the tool? The projection used was the British National Grid coordinate system so this shouldn't have caused the error.

Thanks in advance for your help, and apologies for the delayed response - I have been in and out of the office a fair bit lately! 

Best wishes,

Arne

GokhanNAS
New Contributor II

Hello Richard;

May I ask your kindly support for below error please?

Executing: ConcaveHull MAY2017_Stats 10 "F:\MAY2017_Stats_ConcaveHull1.shp" # #
Start Time: Tue Jul 11 17:14:47 2017
Running script ConcaveHull...

Creating Feature Class...
F:\MAY2017_Stats_ConcaveHull1

Creating data structures...
Finding hull for k = 10
PYTHON ERRORS:
Traceback Info:
File "F:\ESRI LTEA PROJECT\ConcaveHullByCase.py", line 315, in <module>
createHull(pDict, outCaseField, lastValue, kStart, dictCount, includeNull)

Error Info:
<type 'exceptions.TypeError'>: unsupported operand type(s) for -: 'NoneType' and 'float'

GP ERRORS:


Completed script ConcaveHull...
Failed to execute (ConcaveHull).
Failed at Tue Jul 11 17:14:49 2017 (Elapsed Time: 1.34 seconds)

RichardFairhurst
MVP Honored Contributor

I would need more info about the inputs to the tool and the options you were using for the tool parameters.  Was the IncludeNull option set to true?  Did you try it set to false?  Does your input layer contain any features with Null geometry?  The portion of the code that is reporting an error came from Bruce, so I have not really debugged it much or necessarily tried to run all of the potential parameter options.

RobertLakeberg1
New Contributor

Would it be possible to create a similar tool that would output all right angles?  An example of a resulting polygon would be an L.

DorranHowell
New Contributor

FYI - As of Python 3 the <> operator in this tool is deprecated.  You can find-replace it for != to get the tool running again if you're running a newer version of Python.

deleted-user-NkA0KsQXZawo
New Contributor

Hey there, Love the tool, any idea how I can run it from an external IDE, I use eclipse so that I can access other environments outside of ArcPy so i would love to use ConcaveHull() But i dont know where to import it from. It is saved in my toolbox but i think i must have to import some library in my script before I can access your tool

SimonJackson
Occasional Contributor III

Any tips on what needs tweaking to get this running in ArcGIS Pro?

  • Running 2.4 of ArcGIS Pro
  • Trying to create a concave hull on 14k points (will later be expanding the analysis to 2M points)
  • Have tried a few different tests, but I get the following error with k11

 File "C:\_Arcgis_Util\ConcaveHullByCase\ConcaveHullByCase.py", line 57
    hypotList = [math.hypot(pDict[oid][0]-pDict[id][0],pDict[oid][1]-pDict[id][1]) for id in pDict.keys() if id <> oid and id not in excludeList]
                                                                                                                 ^
SyntaxError: invalid syntax
 Failed to execute (ConcaveHull).

Using the minimum bounding geometry - convex hull works ok, but I need a tighter result, so concave looks like the right approach.


Any ideas/pointers?

CharlottePaulet
New Contributor

Hi Dan,

I have the same issue as Simon Jackson but your link doesn't work anymore. Would you mind to post it again?

Thank you very much.

DanPatterson
MVP Esteemed Contributor

Charlotte Paulet‌ since I retired, it is no longer available through my former organization.  You will have to download it from my GitHub site at

Tools_for_ArcGIS_Pro/concavehull at master · Dan-Patterson/Tools_for_ArcGIS_Pro · GitHub 

I haven't used it in a while, so you will have to start a separate thread if you need further assistance.

PS

There are other ArcGIS Pro tools within the github folder structure that may be of interest.