- Home
- :
- All Communities
- :
- Products
- :
- ArcGIS Dashboards
- :
- ArcGIS Dashboards Questions
- :
- Re: Setting a time zone for date fields killed my ...
- Subscribe to RSS Feed
- Mark Topic as New
- Mark Topic as Read
- Float this Topic for Current User
- Bookmark
- Subscribe
- Mute
- Printer Friendly Page
Setting a time zone for date fields killed my dashboard.
- Mark as New
- Bookmark
- Subscribe
- Mute
- Subscribe to RSS Feed
- Permalink
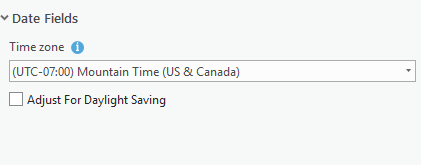
I have a dashboard that charts data by date. The dates were off because Portal defaults to UTC, and converts my data to that, which makes the dates wrong.
I set the time zone when publishing, and now my series charts do not work at all. I did not change the charts. I think the charts just can't seem to handle this adjustment. What happens is that the first time I select data, the chart runs OK. After that, it ignores any inputs. It just becomes unresponsive.
The charts work fine if I do not set a time zone - enter "None'
This is a SERIOUS problem. The client knows when they measured the sites and seeing dates that are one day off is unacceptable.
Thank you,
Randy McGregor.
- Mark as New
- Bookmark
- Subscribe
- Mute
- Subscribe to RSS Feed
- Permalink
OK, I've played with it a bit, and it appears as though correcting the time zone just makes the data series' take much much much longer to load, and the ones with many records simply quit and throw up an error:
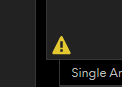
This says, "Cannot Access Data" when you hover over it. When I turn off time zone correction, this data will load and chart fine.
- Mark as New
- Bookmark
- Subscribe
- Mute
- Subscribe to RSS Feed
- Permalink
I have fought with this all day long and I am convinced that operations dashboard will not chart a layer that has a time zone set for it, whether the time zone is set for the layer (in the authoring APRX) or for the map service.
Every single time I set the time zone for my data, my charts stop working.
This is either a bug with operations dashboard or a problem with our configuration.
- Mark as New
- Bookmark
- Subscribe
- Mute
- Subscribe to RSS Feed
- Permalink
I tried making a layer from scratch, with the time zone set, and loading it into a new dashboard. It loaded, but I could not create a series chart or set up a category selector. They simply refused to run. I re-published the service without the time zone, and they both worked.
This is a huge issue, because we need to report the time the data was sampled. It was sampled in the central time zone. Everybody looking at the data knows that, and expects to see times that make sense to them.There is no need to adjust these times. It only creates confusion.
An option to allow your time to be adjusted might be helpful, but I don't think most people want the dates and the times they record to be automatically adjusted by their web software.
- Mark as New
- Bookmark
- Subscribe
- Mute
- Subscribe to RSS Feed
- Permalink
Hi Randy,
Sorry to hear about your trouble. Charts (and all visual elements) should work with layers having date fields with a time zone specified. After you publish your layers with your time zone specified on your date field(s), refresh your dashboard and try re-creating it as a new chart. Schema changes to your layer may cause existing visual elements to have problems, as they store info about the schema.
If the problem persists, please reach out to Esri Tech Support to troubleshoot and/or log this bug. The dashboard team will need more details and a reproducible case in order to fix it.
Dave