- Home
- :
- All Communities
- :
- Products
- :
- ArcGIS Dashboards
- :
- ArcGIS Dashboards Questions
- :
- Relate chart to feature selection in dashboard map
- Subscribe to RSS Feed
- Mark Topic as New
- Mark Topic as Read
- Float this Topic for Current User
- Bookmark
- Subscribe
- Mute
- Printer Friendly Page
Relate chart to feature selection in dashboard map
- Mark as New
- Bookmark
- Subscribe
- Mute
- Subscribe to RSS Feed
- Permalink
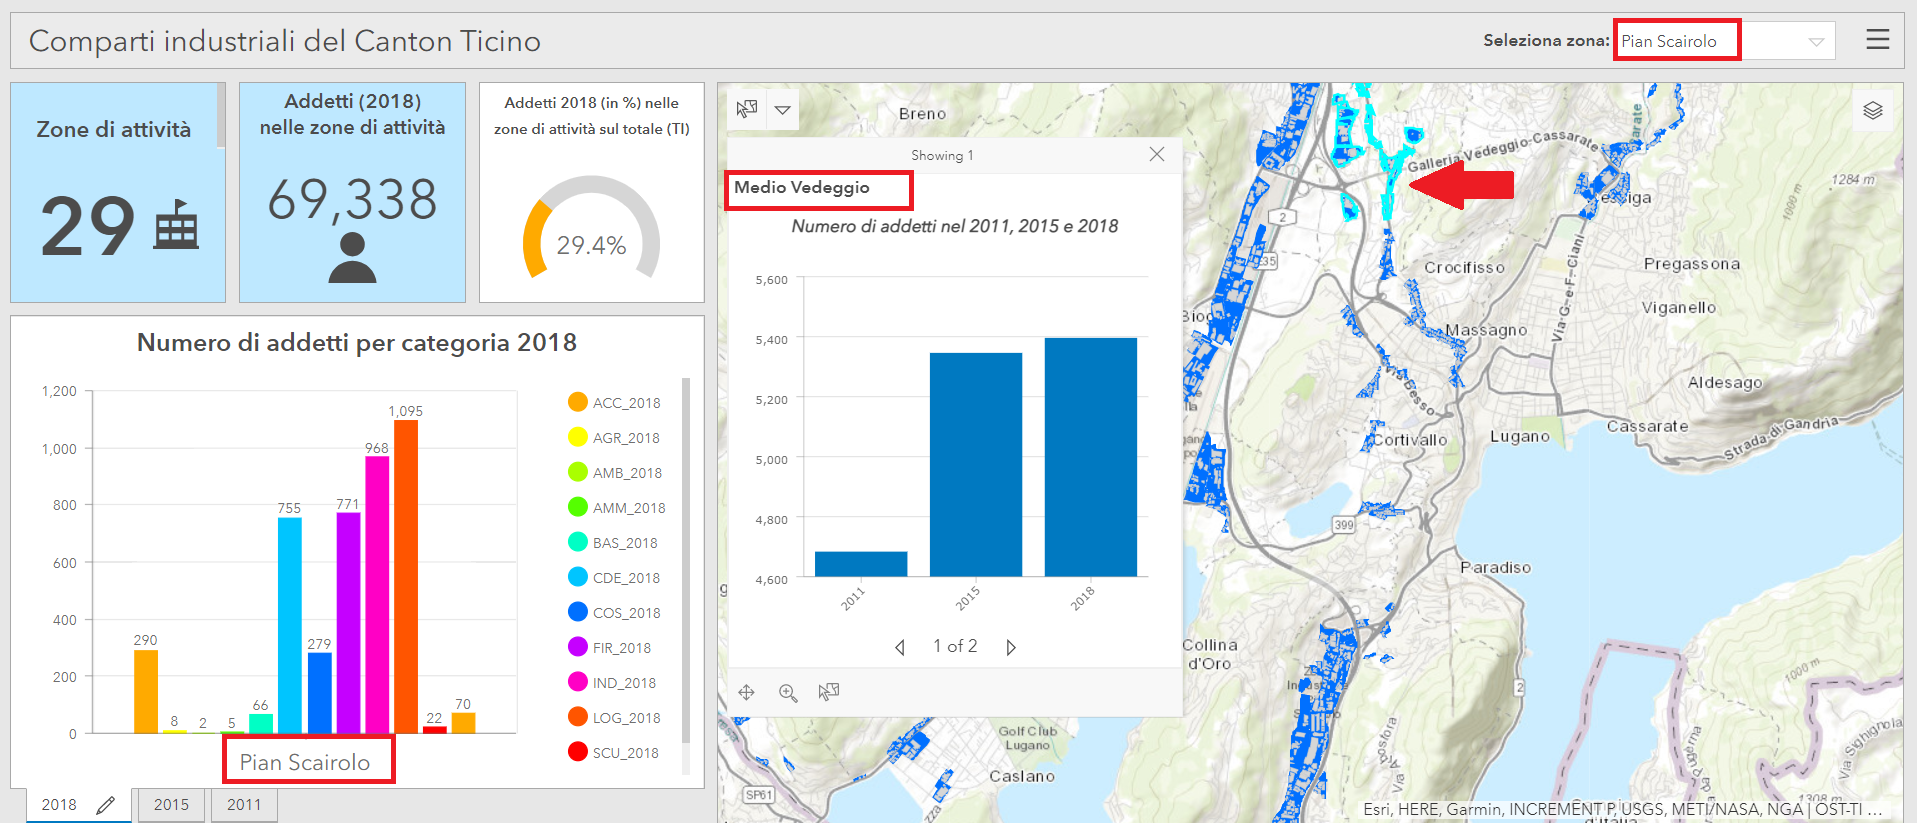
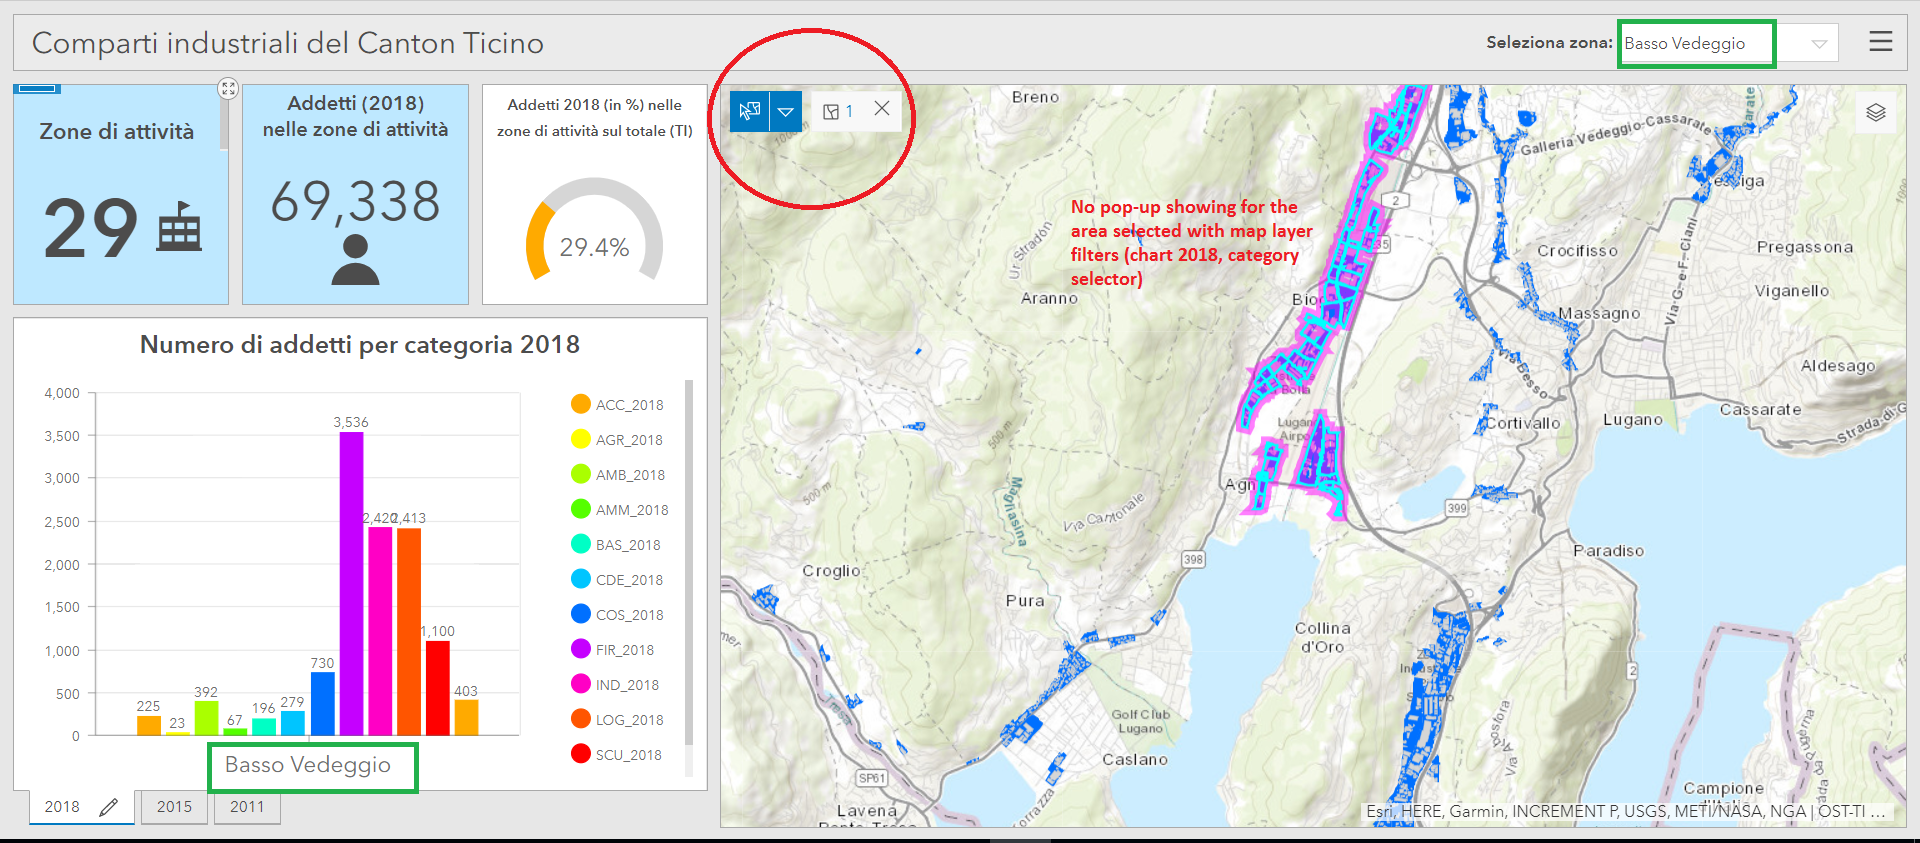
Hello everybody, I am creating my first ops dashboard and I am struggling with relations between dynamic charts and map layers.
Using the category selector (created on the header, right corner) I can easily select an area (layer feature) of interest. The map pan to the area, the popups are showing and the dynamic chart on the left adapt to the selected area and shows the right data.
But: when I select manually an area (feature) in my map, the related pop-up appears and updates correctly, while the category selector and the dynamic 2018 chart (left bottom-corner of my dashboard) do not update to the new selected area. The dynamic chart shows data from a layer in the map for which pop-ups are not enabled. I tried to add filter to the map layer actions, but then the popups are not showing and I would like that the three elements (pop-ups, chart and category selector) are correctly updated simultaneously every time I select an area in the map.
Is there a way to update the category selector and the chart when features are selected manually on the map?
Any suggestion is welcome, thank you!
Giulia