- Home
- :
- All Communities
- :
- Products
- :
- ArcGIS Dashboards
- :
- ArcGIS Dashboards Questions
- :
- Filter map based on dashboard selection
- Subscribe to RSS Feed
- Mark Topic as New
- Mark Topic as Read
- Float this Topic for Current User
- Bookmark
- Subscribe
- Mute
- Printer Friendly Page
Filter map based on dashboard selection
- Mark as New
- Bookmark
- Subscribe
- Mute
- Subscribe to RSS Feed
- Permalink
In my dashboard (here), the different dashboard elements are linked so that if you click one bar on the bar chart, for example, the other dashboard pieces update. For example, if you click one tree species, the "number of trees planted" updates to show only the number of that species. This is GREAT!
But how do I make the map update too? That is, when you click one particular species in the bar chart, can you make the map show only those trees?
- Mark as New
- Bookmark
- Subscribe
- Mute
- Subscribe to RSS Feed
- Permalink
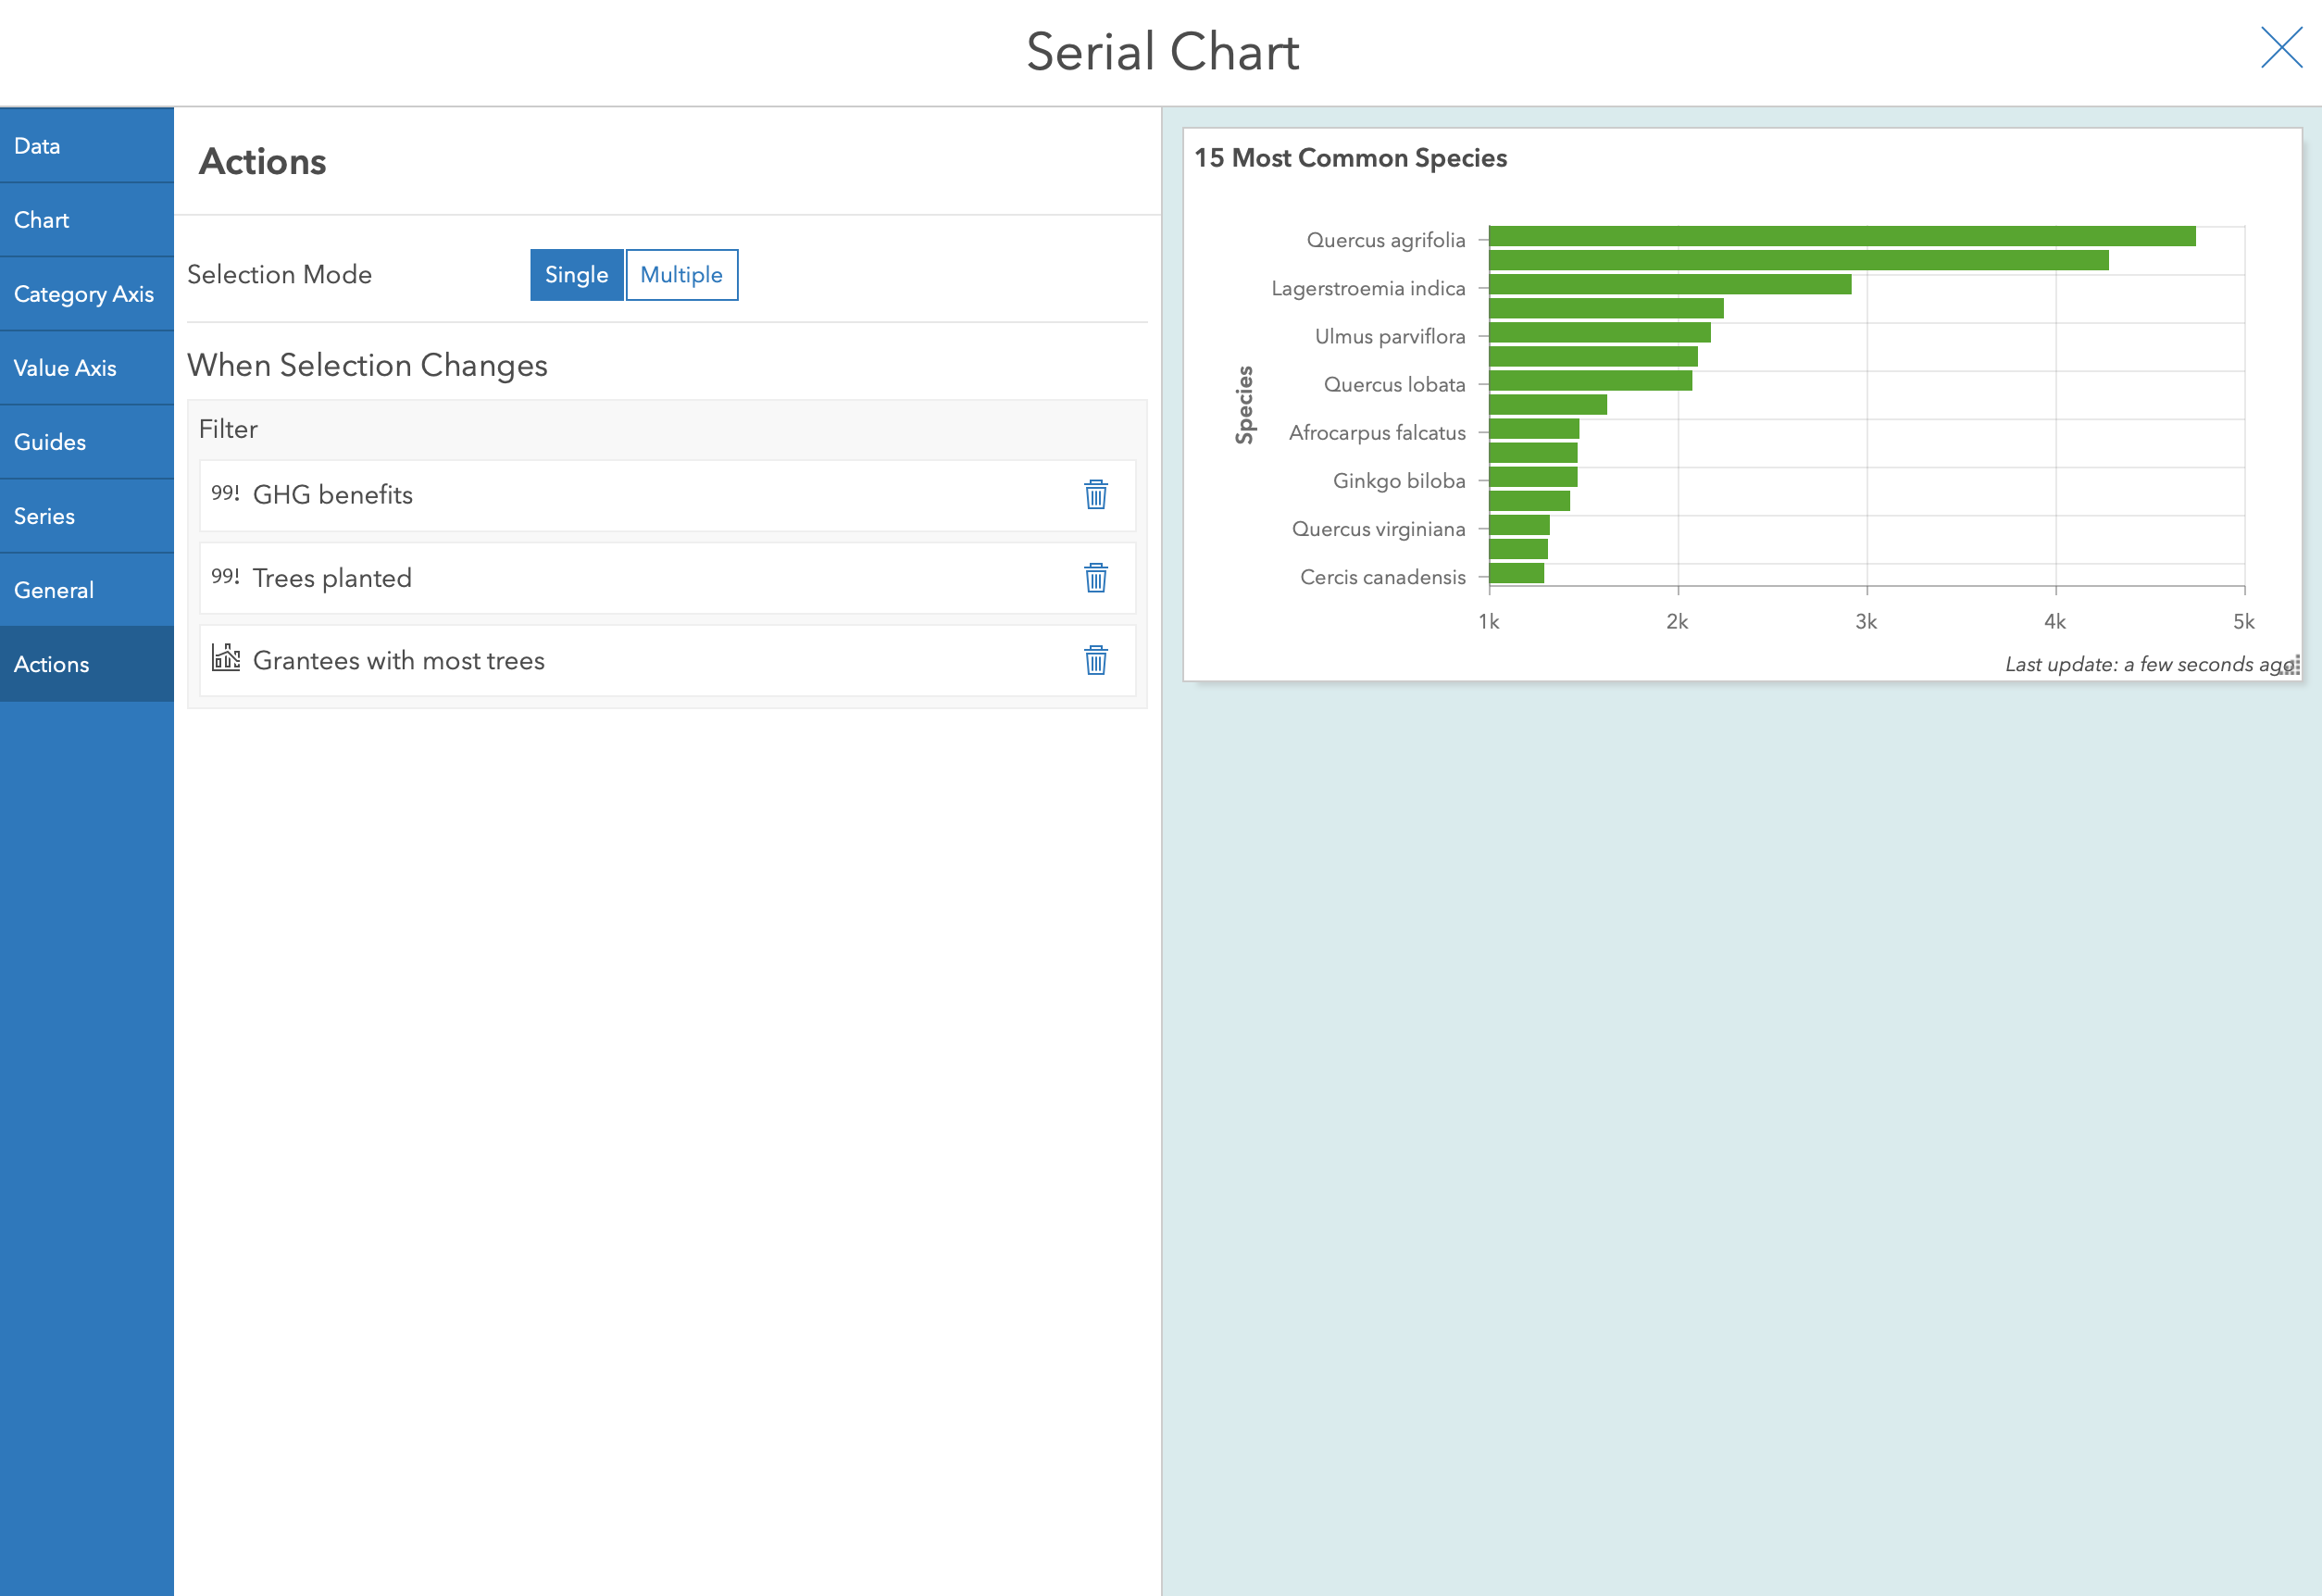
Looking at other related queries, it seems like the map layer should be showing up under Actions in the element's configuration, but it's not.

- Mark as New
- Bookmark
- Subscribe
- Mute
- Subscribe to RSS Feed
- Permalink
Moved your question to arcgis dashboard questions
Community Feedback is to get feedback on the esri Community structure, functionality etc
... sort of retired...
- Mark as New
- Bookmark
- Subscribe
- Mute
- Subscribe to RSS Feed
- Permalink
Ooops! Thanks for the help!
- Mark as New
- Bookmark
- Subscribe
- Mute
- Subscribe to RSS Feed
- Permalink
Hi @KelaineRavdin,
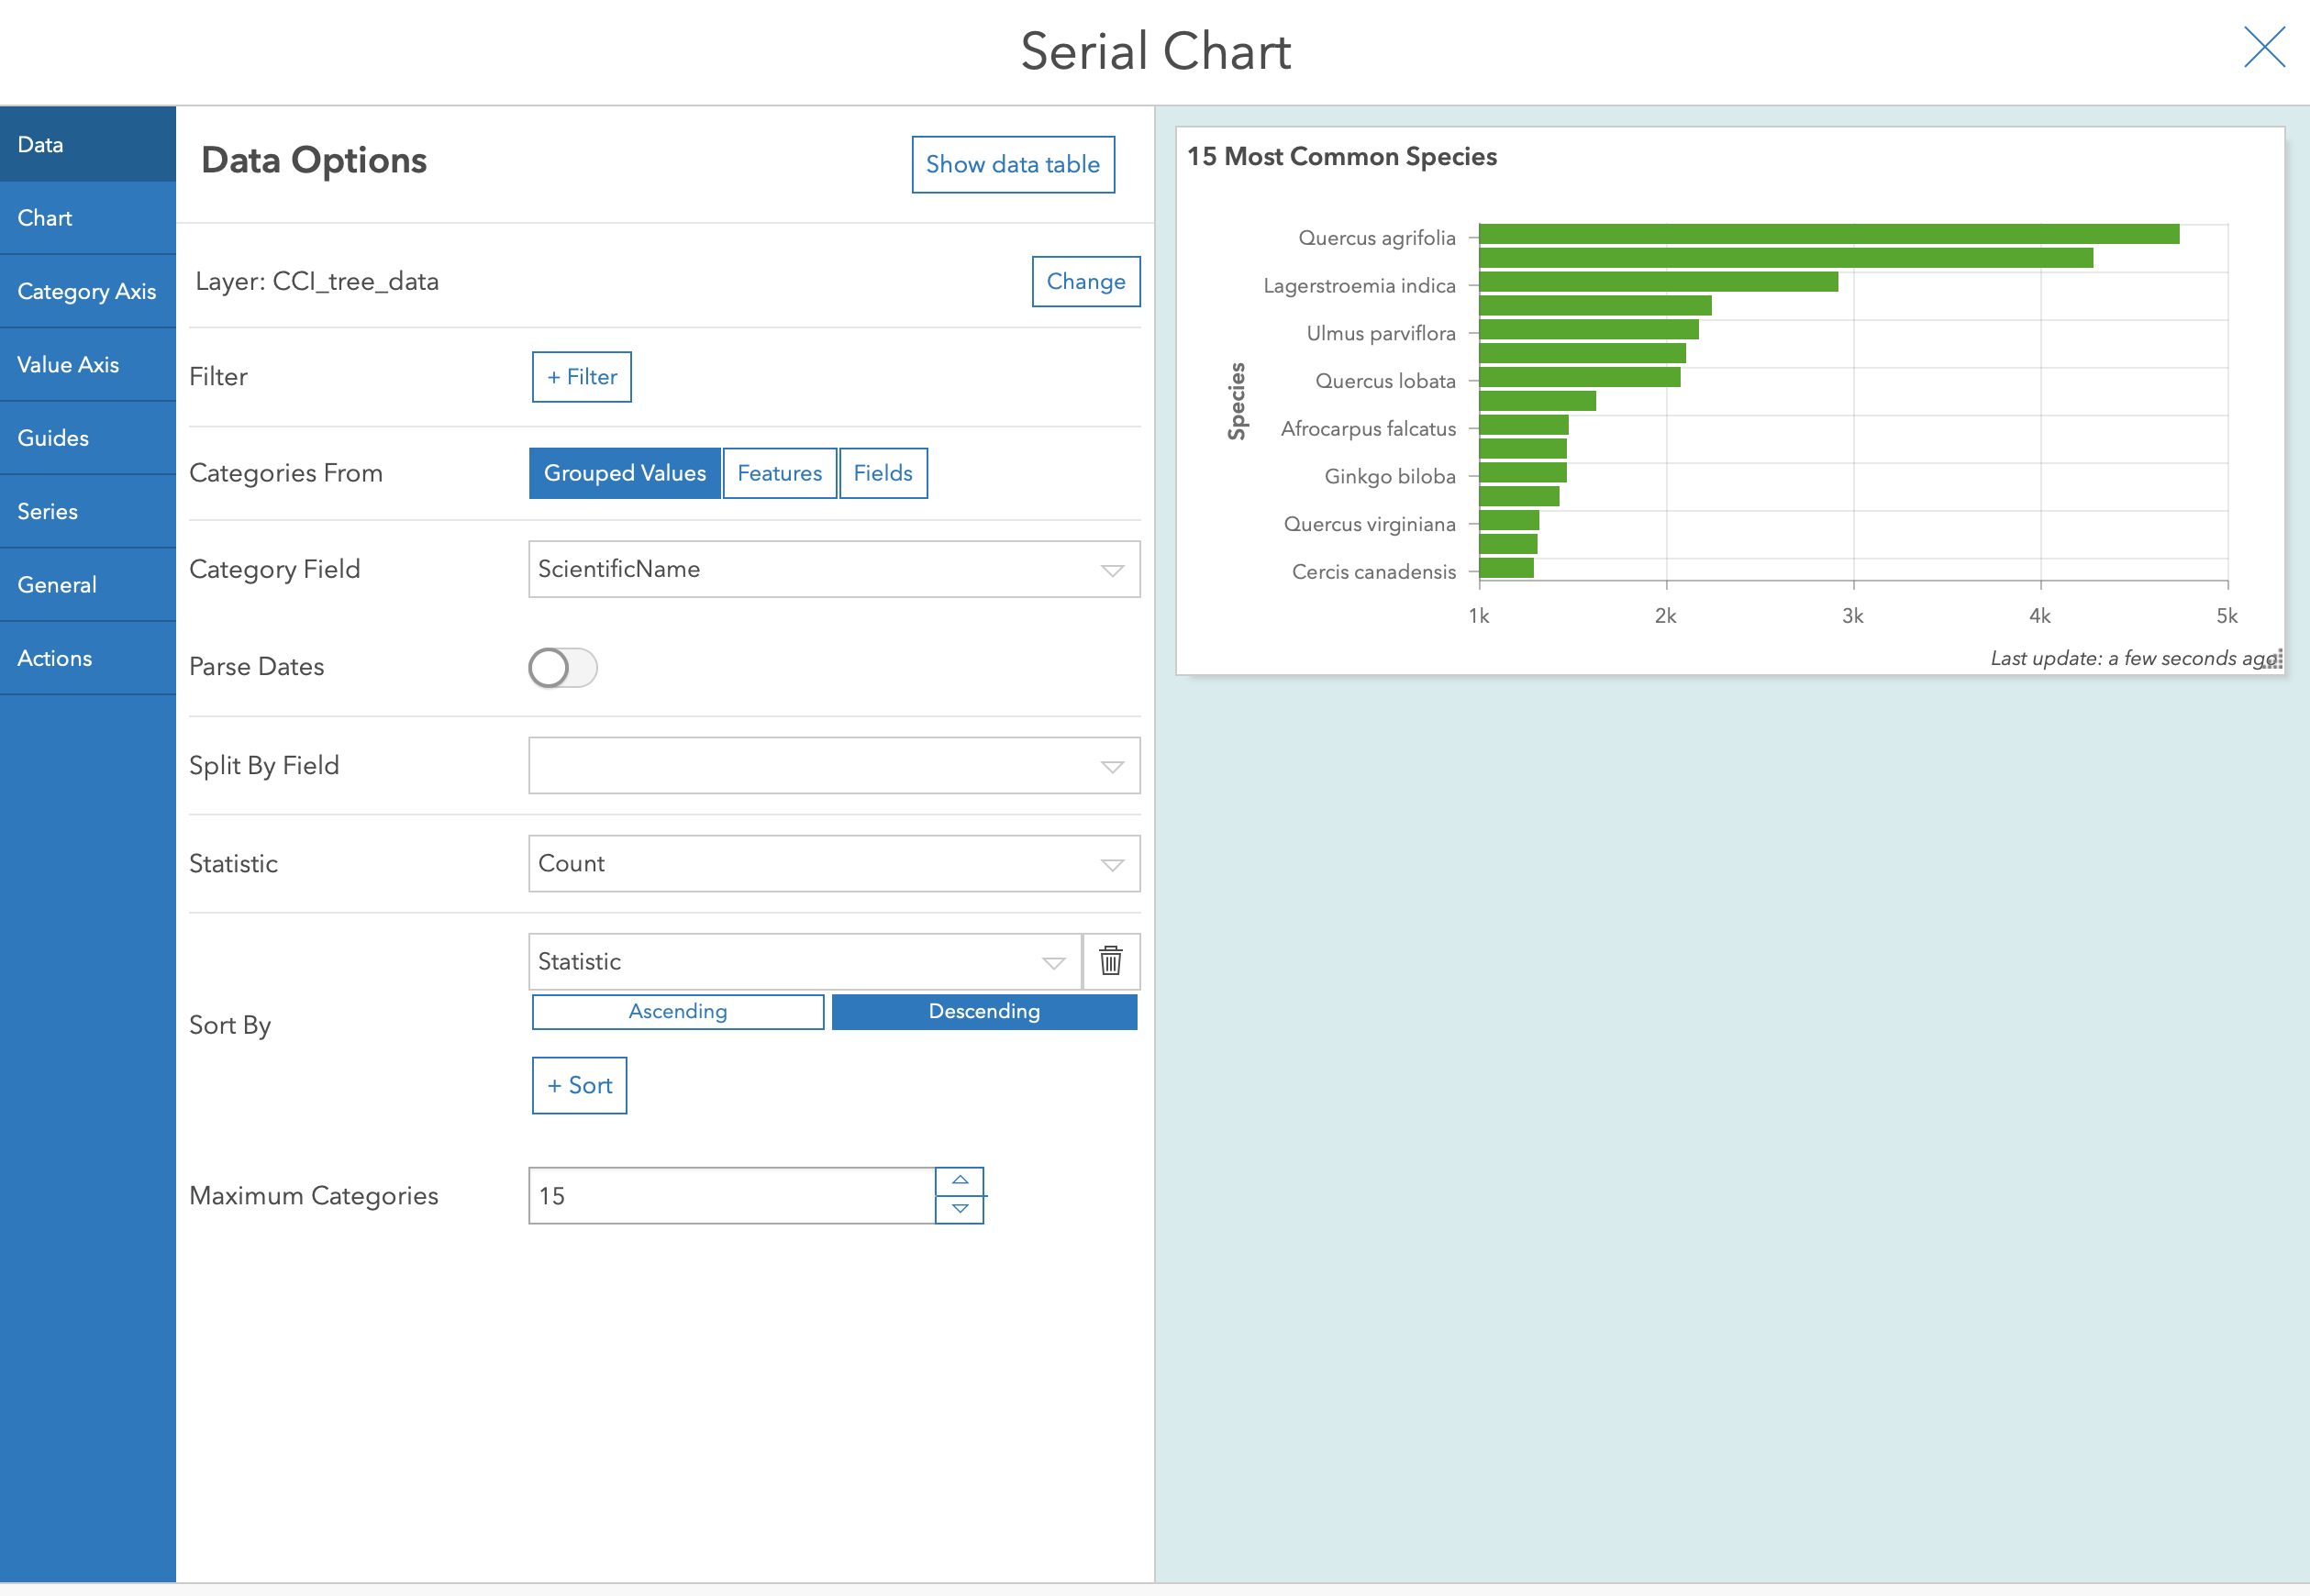
Are you able to share some screen captures of the serial chart settings? 'Data' and 'Series' would be useful.
I have seen this before though I can't quite remember the exact issue... I feel like it is something to do with the way the chart is created, though I may be wrong!
Jamie.


- Mark as New
- Bookmark
- Subscribe
- Mute
- Subscribe to RSS Feed
- Permalink
Its a bit of a pickle. Have you tried recreating the serial chart? Or using Dashboards Beta?
- Mark as New
- Bookmark
- Subscribe
- Mute
- Subscribe to RSS Feed
- Permalink
I'm having the same problem. A dashboard that I created in October uses a Series chart to filter what's visible on the map by clicking on the individual bars in the Chart. When I tried to create a similar dashboard this week for another department I cannot get the filter to work at all. The map layer (which is the same data source that is being used in the chart, I quadruple checked this) is not showing up as an option in the actions panel. When I went back to the older dashboard, I noticed the filtering was not working on this dashboard either (even though we know it's worked in the past. I can produce witnesses). When I go back to the Actions of the previously working dashboard the Target layer (the map layer) now says "The target element as a configuration issue". I think something happened during the April update. The older dashboard and the one I'm currently trying to create have both been done in Dashboards Beta.
- Mark as New
- Bookmark
- Subscribe
- Mute
- Subscribe to RSS Feed
- Permalink
Thanks to you both! I'll try rebuilding the whole thing in Dashboards Beta, but based on OlesyaPowers1's experience, it doesn't sound promising. Hopefully we'll still get some other ideas.
- Mark as New
- Bookmark
- Subscribe
- Mute
- Subscribe to RSS Feed
- Permalink
Try building your category selector from "Features" instead of "Grouped Values" as the map actions are different depending on the category selector type. "Features" allows Flash, Pan, and Zoom (in addition to filter). Hope that helps!