- Home
- :
- All Communities
- :
- Products
- :
- ArcGIS Dashboards
- :
- ArcGIS Dashboards Blog
- :
- How to Create a Simple Real-Time Dashboard
How to Create a Simple Real-Time Dashboard
- Subscribe to RSS Feed
- Mark as New
- Mark as Read
- Bookmark
- Subscribe
- Printer Friendly Page
Setting the Stage
In winter months, many cities are struck with extreme snowstorm events that can leave people stranded for hours or even days. Operations managers need to monitor snow event responses and determine which streets are not getting attention.
Using Operations Dashboard for ArcGIS let’s create a dashboard that can be used to see the condition of the streets, status of the snow removal operations, and snow-related complaints that have been reported. We’ve used GeoEvent Server to bring the following data feeds into ArcGIS Online:
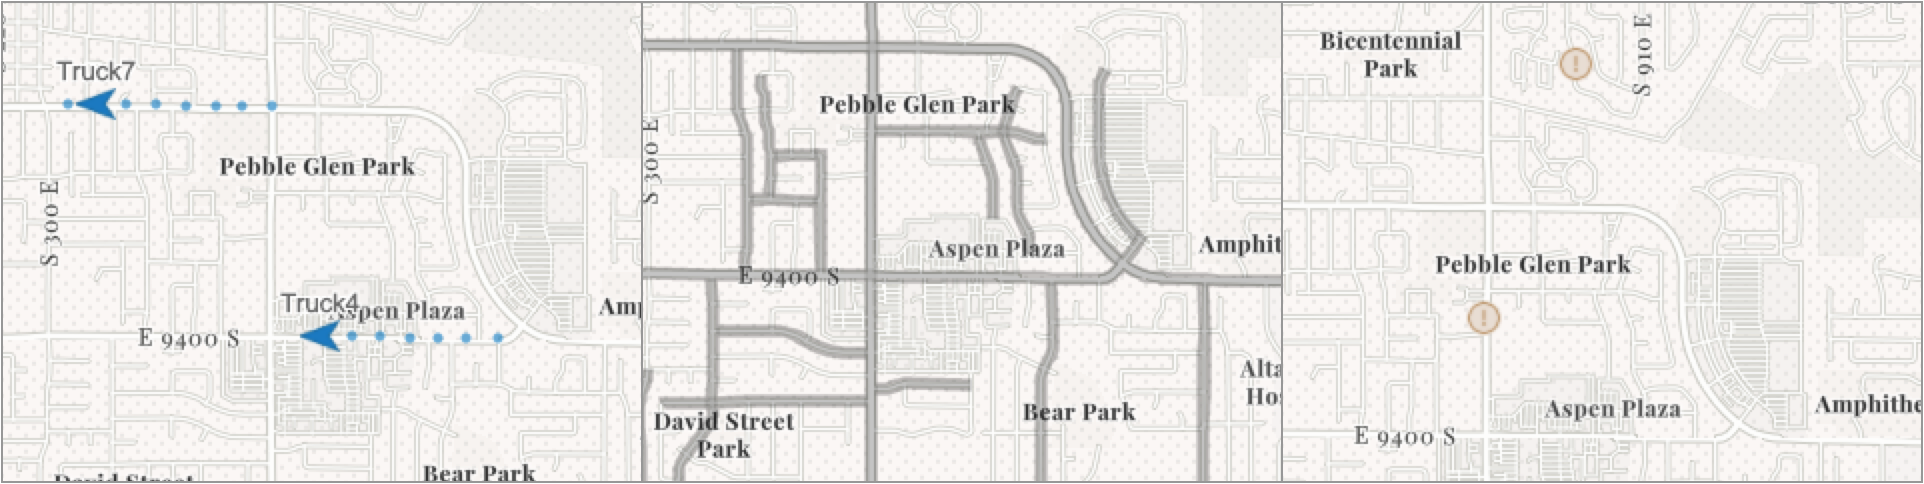
- Locations of plow trucks
- The status of the main streets based on recent passes from plows
- Snow-related complaints that have been reported
What is a Dashboard?
Simply put, a dashboard is an item in ArcGIS Online (and soon ArcGIS Enterprise). Using Operations Dashboard, you can configure a simple or advanced web app to visualize your data for at-a-glance decision making. See our documentation page for more details.
“A dashboard is a view of geographic information that helps you monitor events or activities. Dashboards are designed to display multiple visualizations that work together on a single screen. They offer a comprehensive and engaging view of your data, to provide key insights for at-a-glance decision making.”
Designing Your Dashboard
Often, the best first step in designing a dashboard is to come up with a list of questions that the end user(s) would like it to answer at-a-glance. The following questions are applicable to our scenario.
- How many current complaints are there?
- How many streets have been plowed?
- Which plow was at the site of a broken mailbox complaint and when?
- Where is a particular truck, and how fast is it going?
Next, determine how the dashboard will be viewed. Will it be unattended (e.g., on a wall-mounted screen) or interactive (e.g., used on a desktop or tablet)? If unattended, then all information should be accessible without clicking anything. If interactive, we can take advantage of stacking elements and interactive filtering. OK, let’s build an interactive dashboard.
Creating Your Dashboard
When signed into your ArcGIS Online organization, on the Content page you can create a dashboard from the Create button. You can also click the App Launcher next to your user name in the header to open the home page of Operations Dashboard.
For this exercise, we’ll create it directly from a webmap.
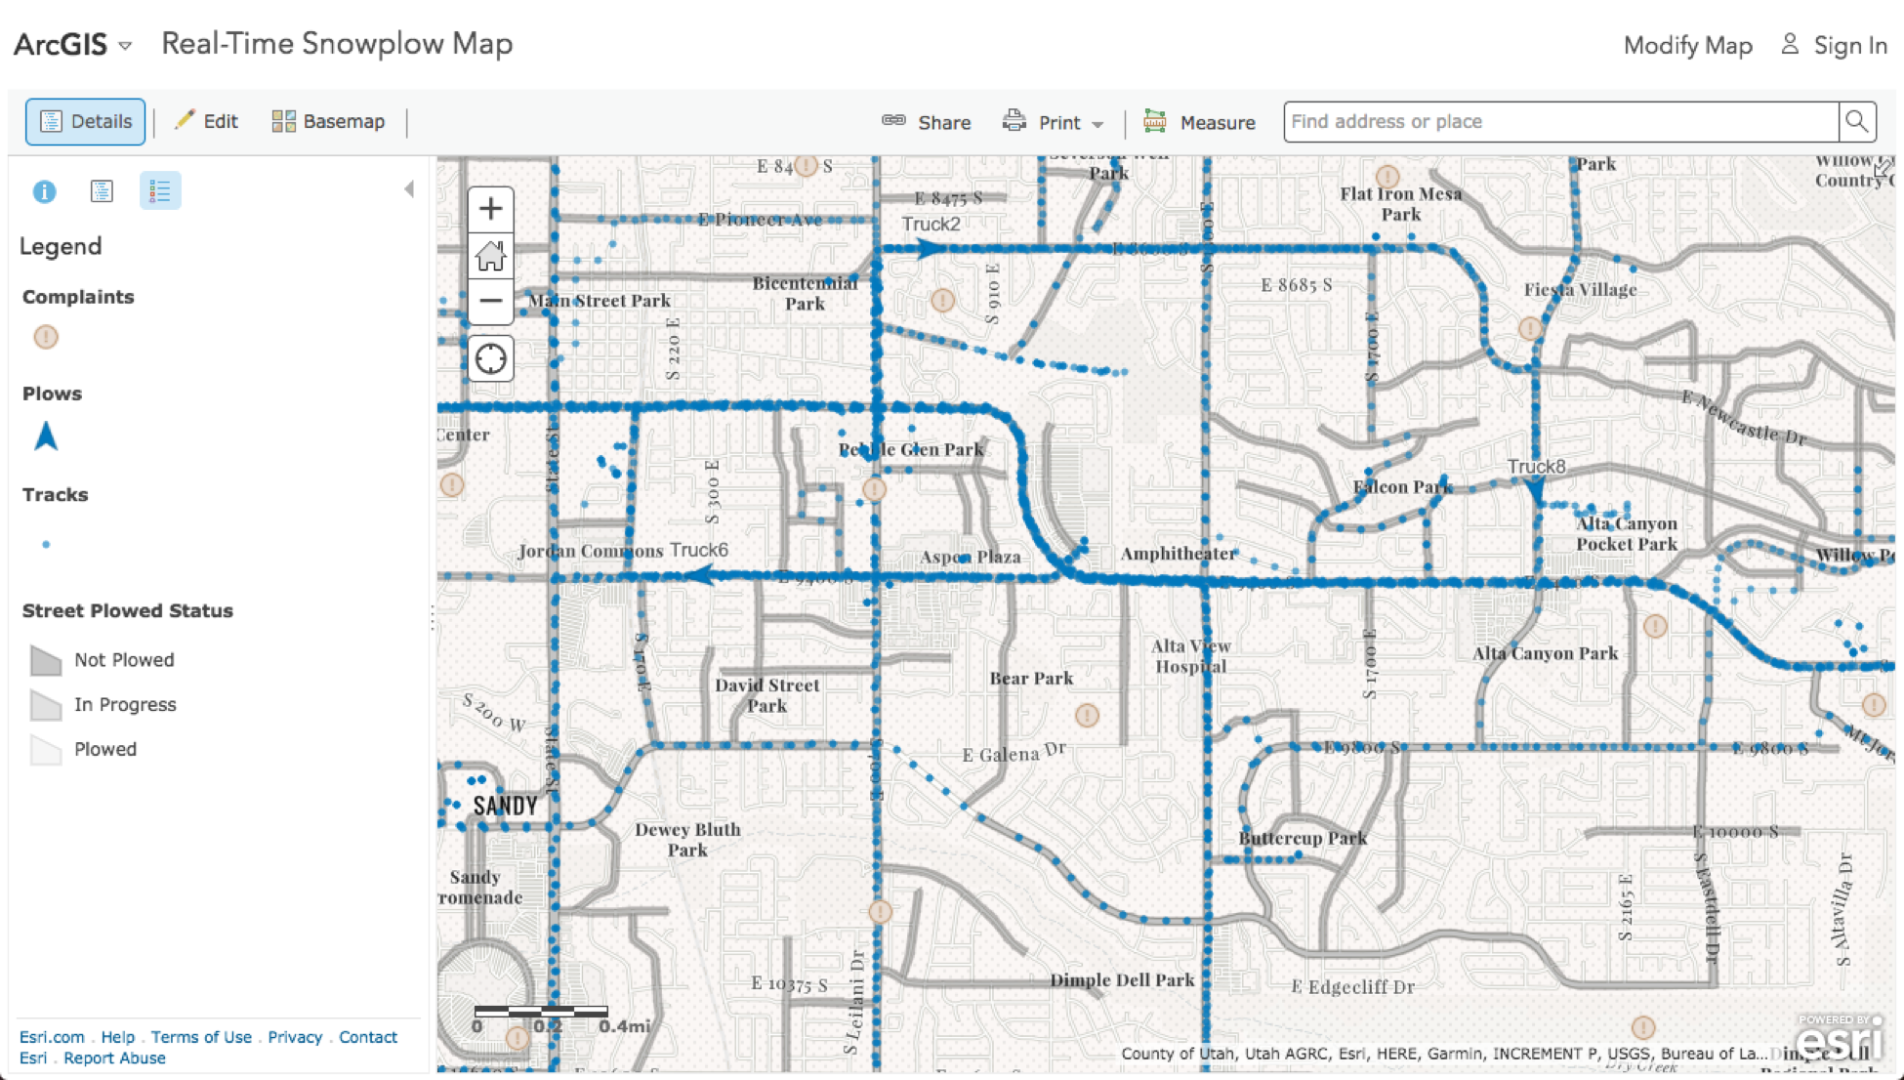
- Open the Real-Time Snowplow Map
- In the upper right, sign in to your ArcGIS Online account.
Note: Non-organizational public accounts and Level 1 accounts do not support creating dashboards. You need to be a Level 2 account in your organization.
Consider the theme you'd like to use (dark or light) and the colors of your dashboard. The symbology and basemap in this webmap were specifically chosen to support a light themed Dashboard. If you would like to customize the map, do a Save As to create a copy. Otherwise continue to the next step.
Tip: Your basemap, symbology and the rest of the dashboard elements should complement each other. Bright colors should be used to draw the viewer’s eyes to important things, such as the vehicles and complaints.
- Create a dashboard that includes this map. Click the Share button on the toolbar.
- Click Create a Web App.
- Choose the Operations Dashboard tab.
- Fill in your title and press Done.
Adding Elements to the Dashboard
Now that you are editing your dashboard, let's add some elements to it. Elements include data visualizations such as maps, lists, charts, gauges, and indicators. It is important that you carefully consider which elements best display the information you want.
Indicator
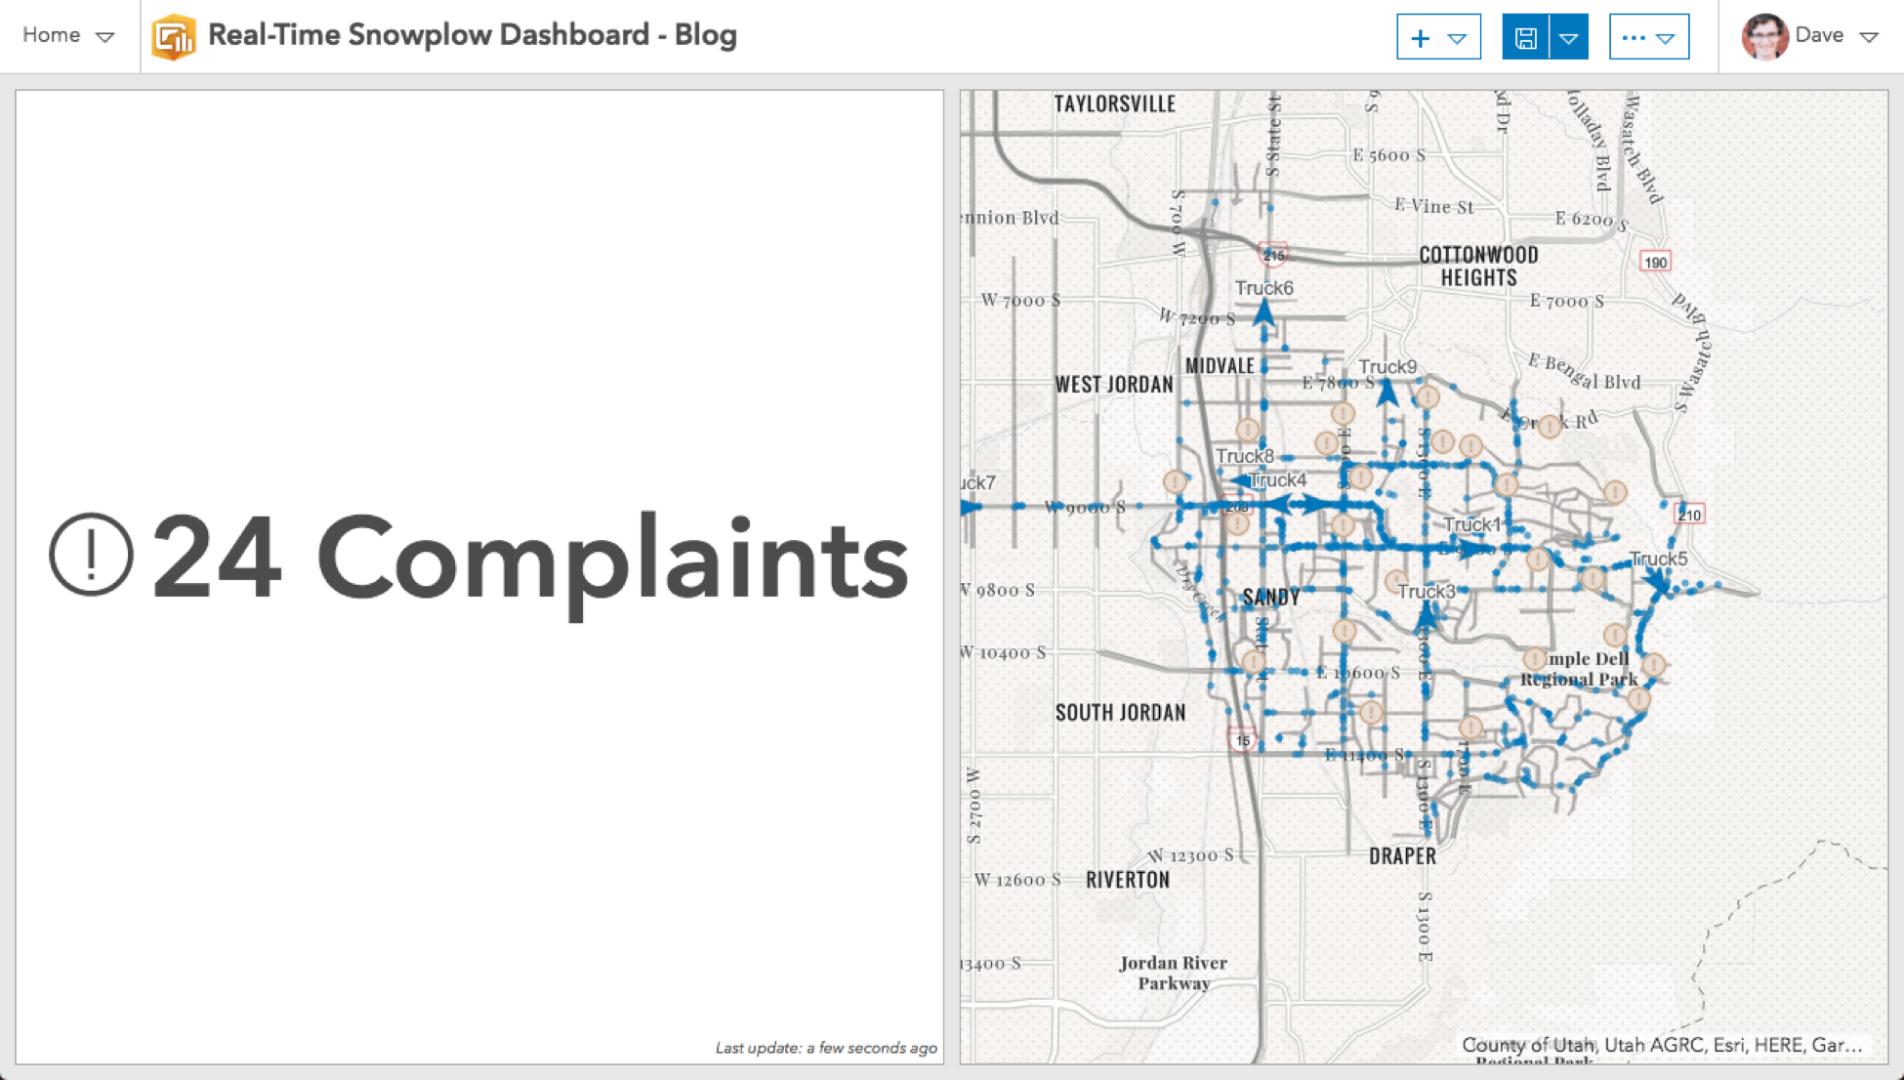
In the Designing Your Dashboard section above, we said that we’d like to show how many complaints have been reported. Let’s do this with an Indicator.
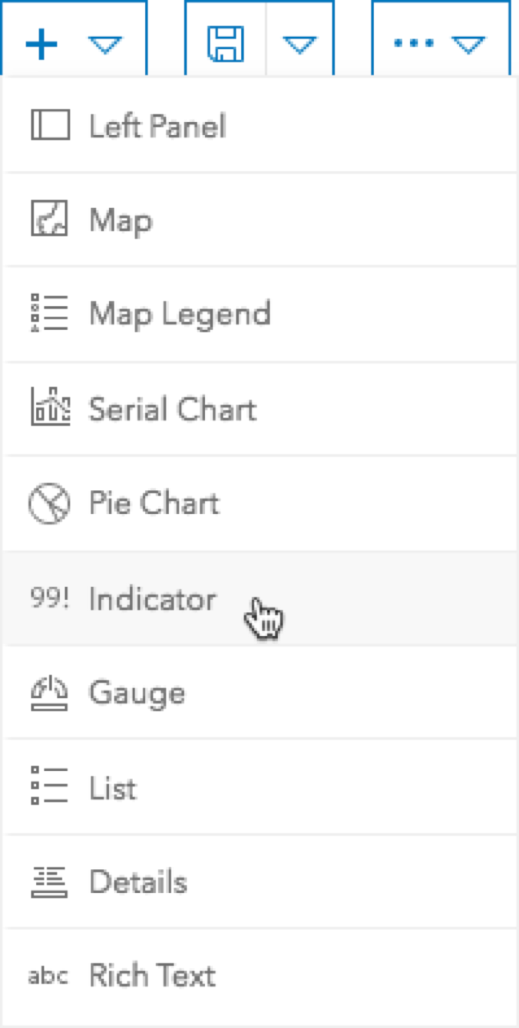
- From the + menu in the navigation panel, choose Indicator.
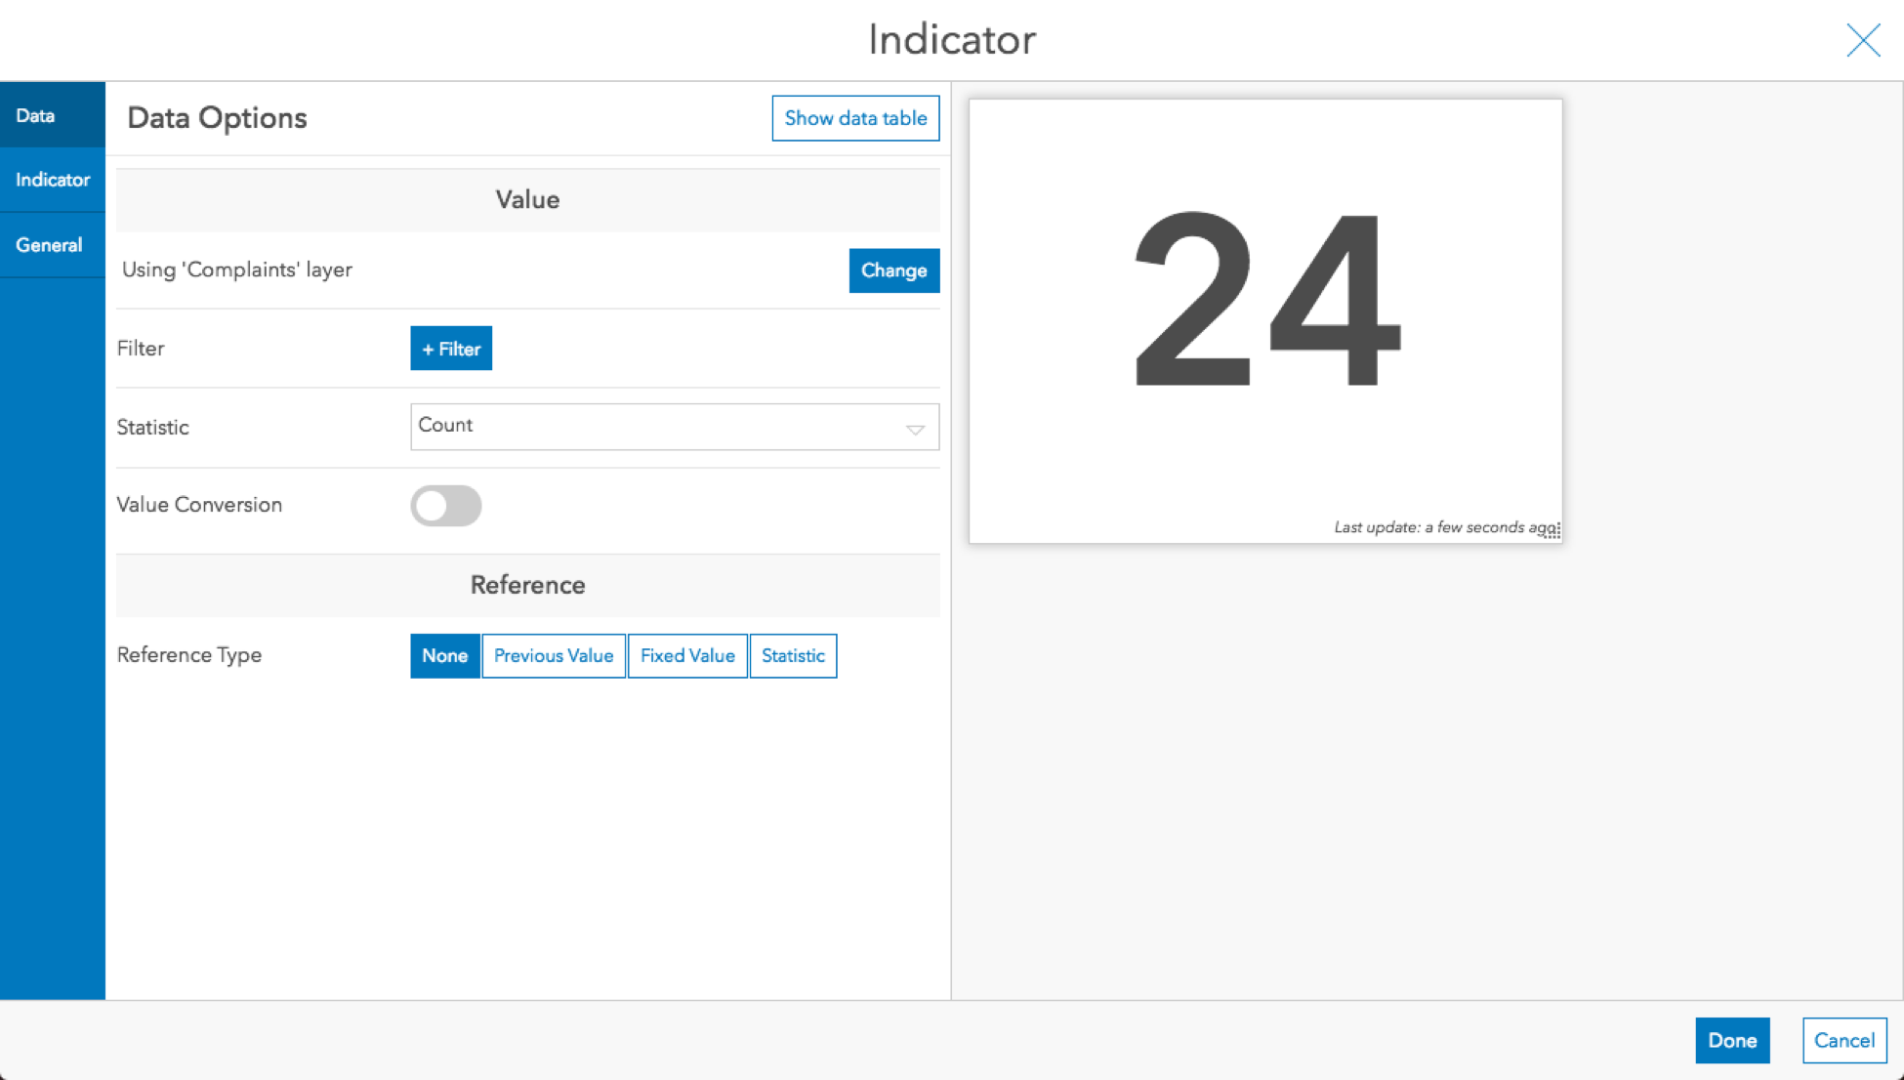
- Choose the Complaints layer as the data source.
- By default, it displays a count statistic, which is what we want (the number of complaints/features).
Let’s add some text to the number displayed. Click the Indicator tab.
In the Middle Text input, add the text “ Complaints” making the full text read “{value} Complaints”
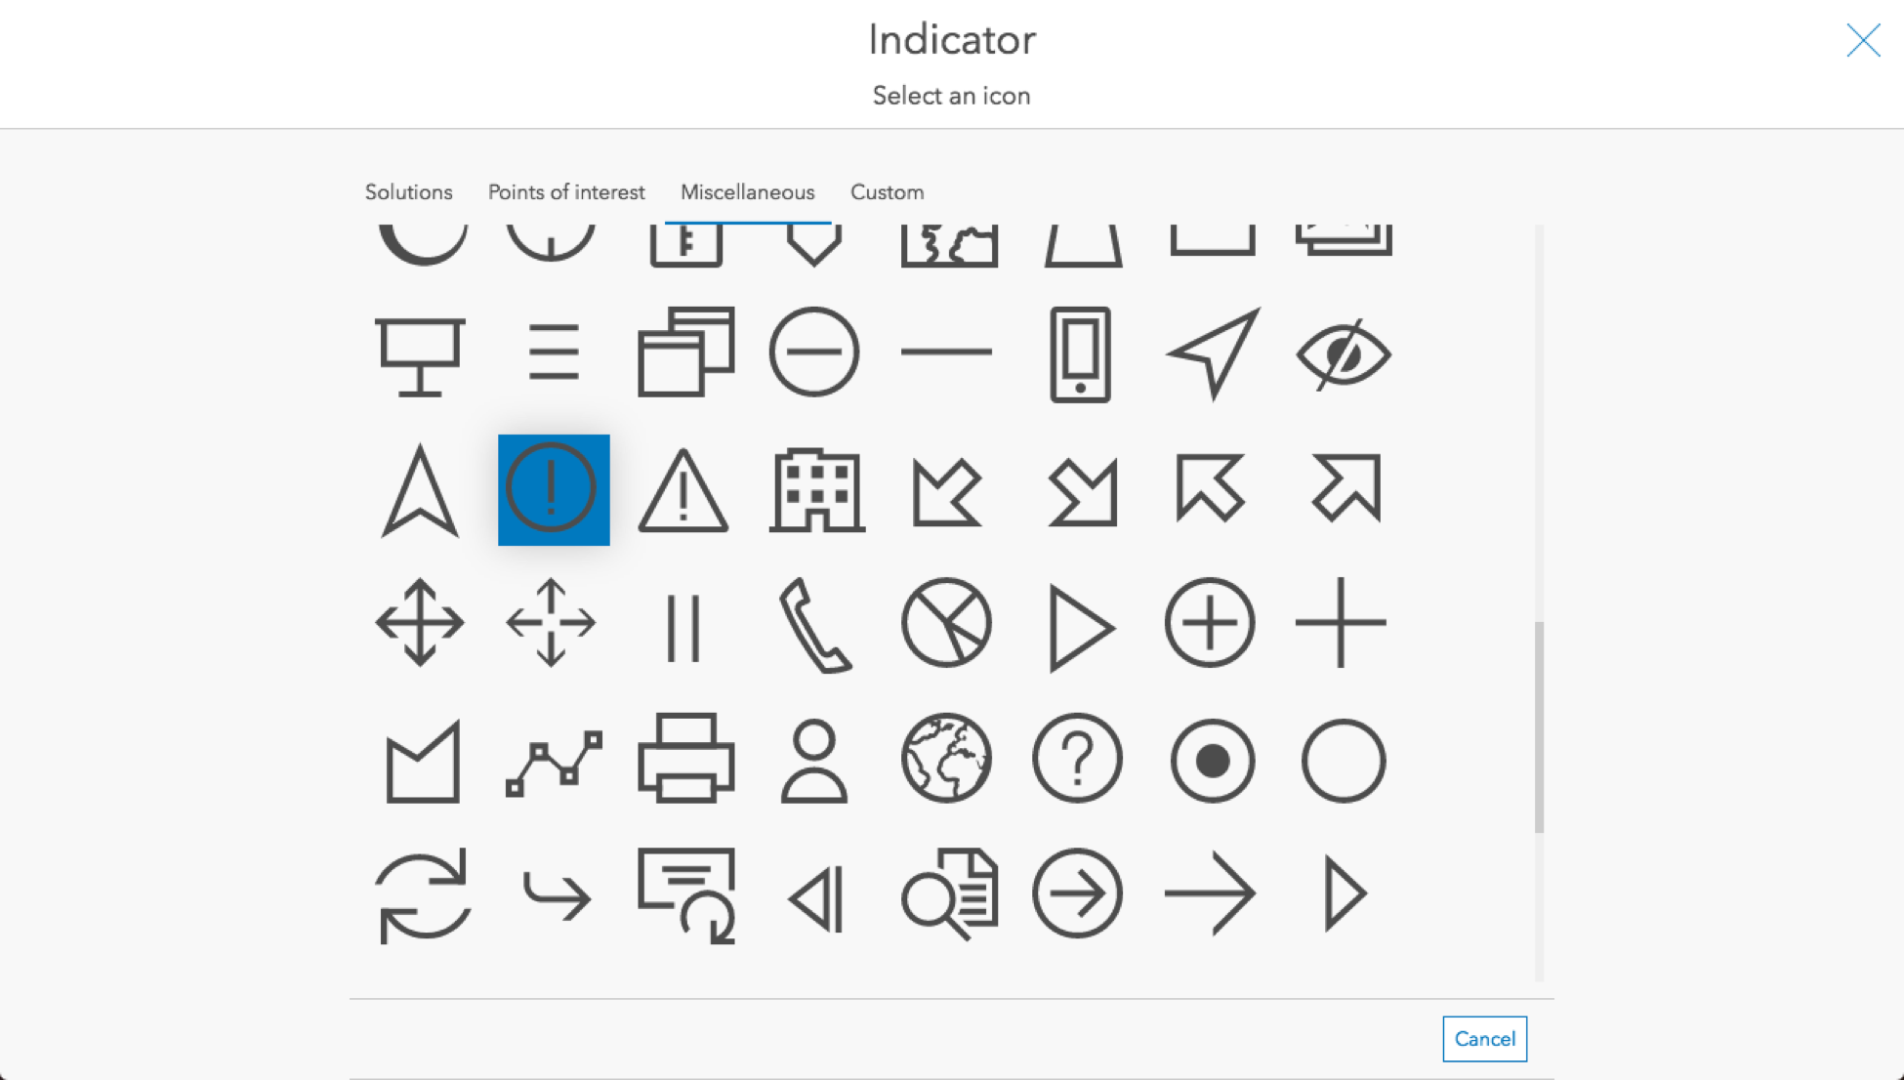
- Add an icon by clicking the Left button for the Icon property and choosing an icon.
Tip: It is a best practice to give each element a name. Go to the General tab and update the Name property. Names are used later when you wire up actions. I'll be skipping this step in this post for simplicity.
- Click Done on the footer to add the Indicator to the dashboard.
Serial Chart
Let’s add a bar chart showing the number of complaints per type. The Serial Chart is used to create bar charts, line charts, area charts, and combinations of these.
- From the + menu in the navigation panel, choose Serial Chart.
- Choose the Complaints layer as the data source.
- By default, it generates categories from Grouped Values, which is what we want in this case.
Tip: There are ways to create categories with data in other formats. Read the help page for more details.
- For the Category Field property, choose Description.
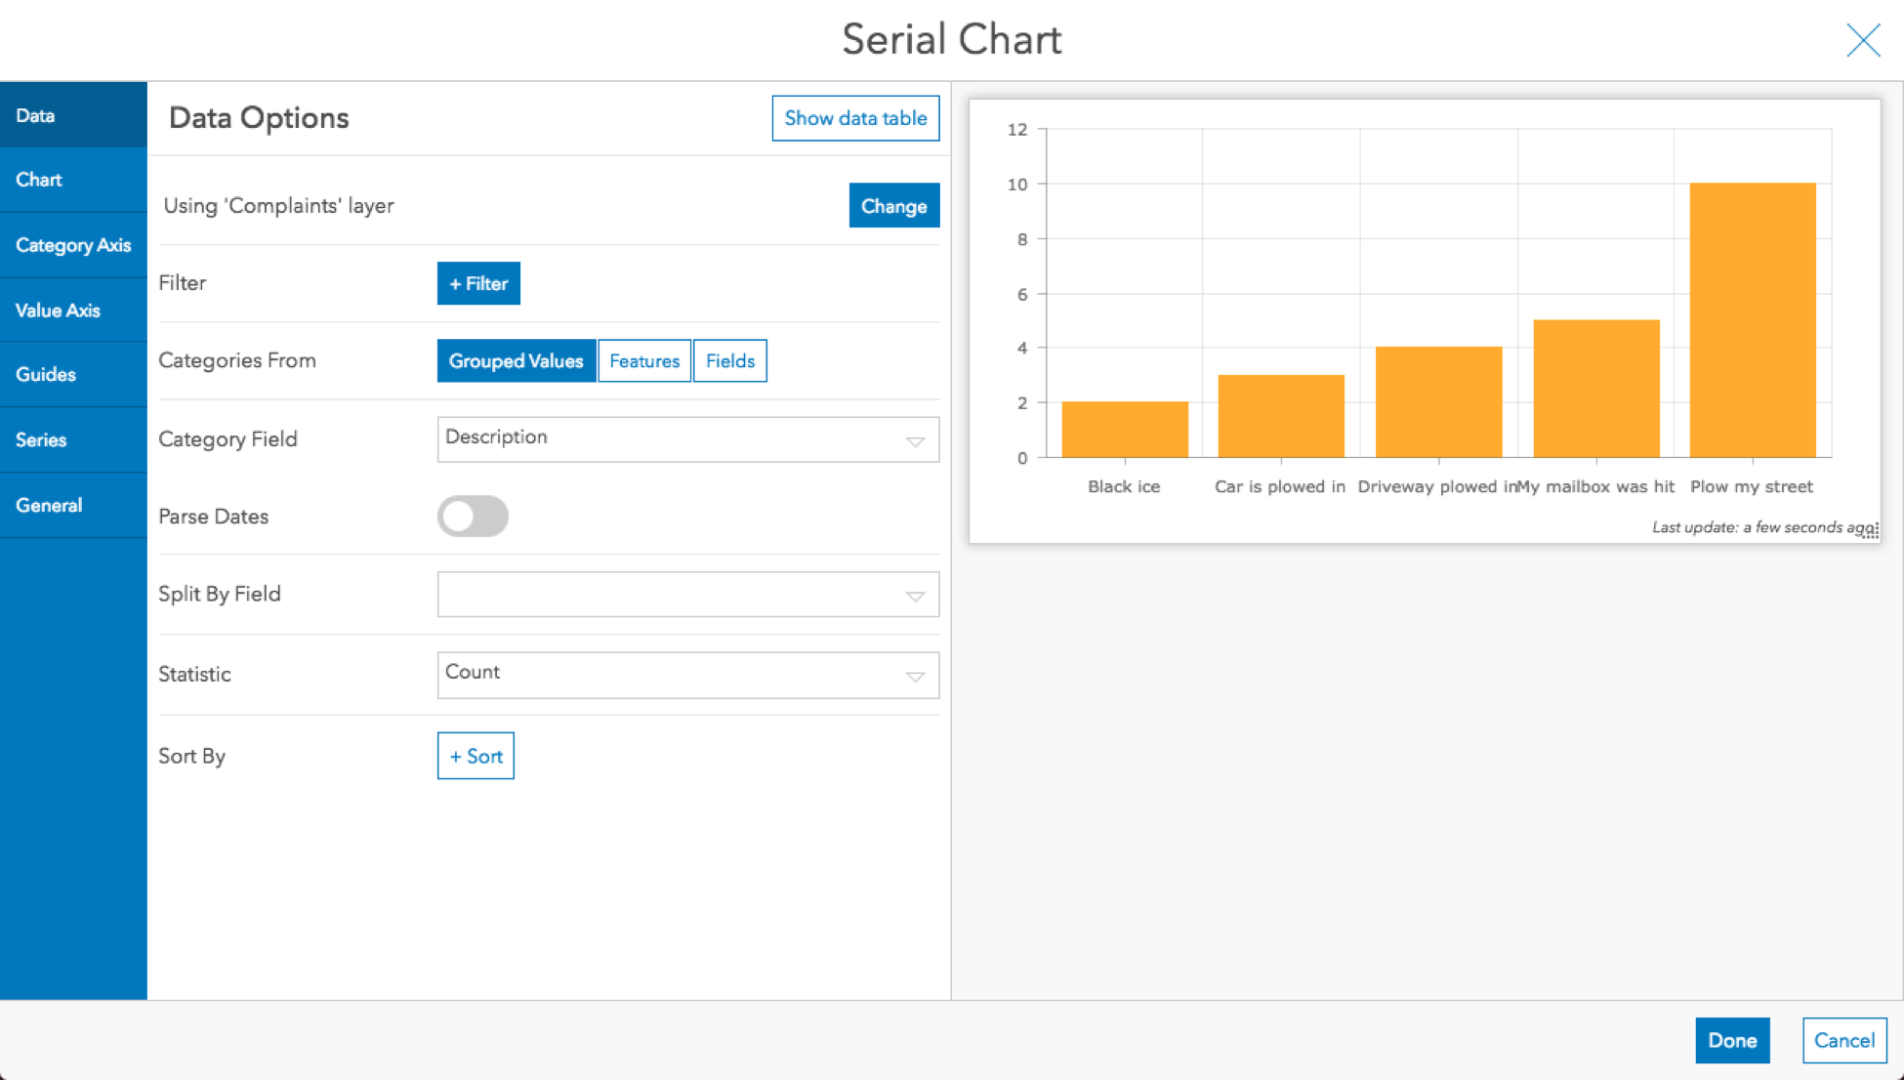
- Keep the Statistic type as Count. It shows the number of each type of complaint.
- Since the category labels are longer, we’ll want to adjust them so they don’t collide. Going to the Category Axis For the Placement property, choose Staggered.
- To change the color of the bars, go to the Series tab and change the Color
- Press Done to add the Serial Chart to the dashboard.
List
We can also show a List of the complaints.
- From the + menu in the navigation panel, choose List.
- Choose the Complaints layer as the data source.
- In the List tab, add some text to the Line Item Text
- Click the {} dropdown and choose the Description field.
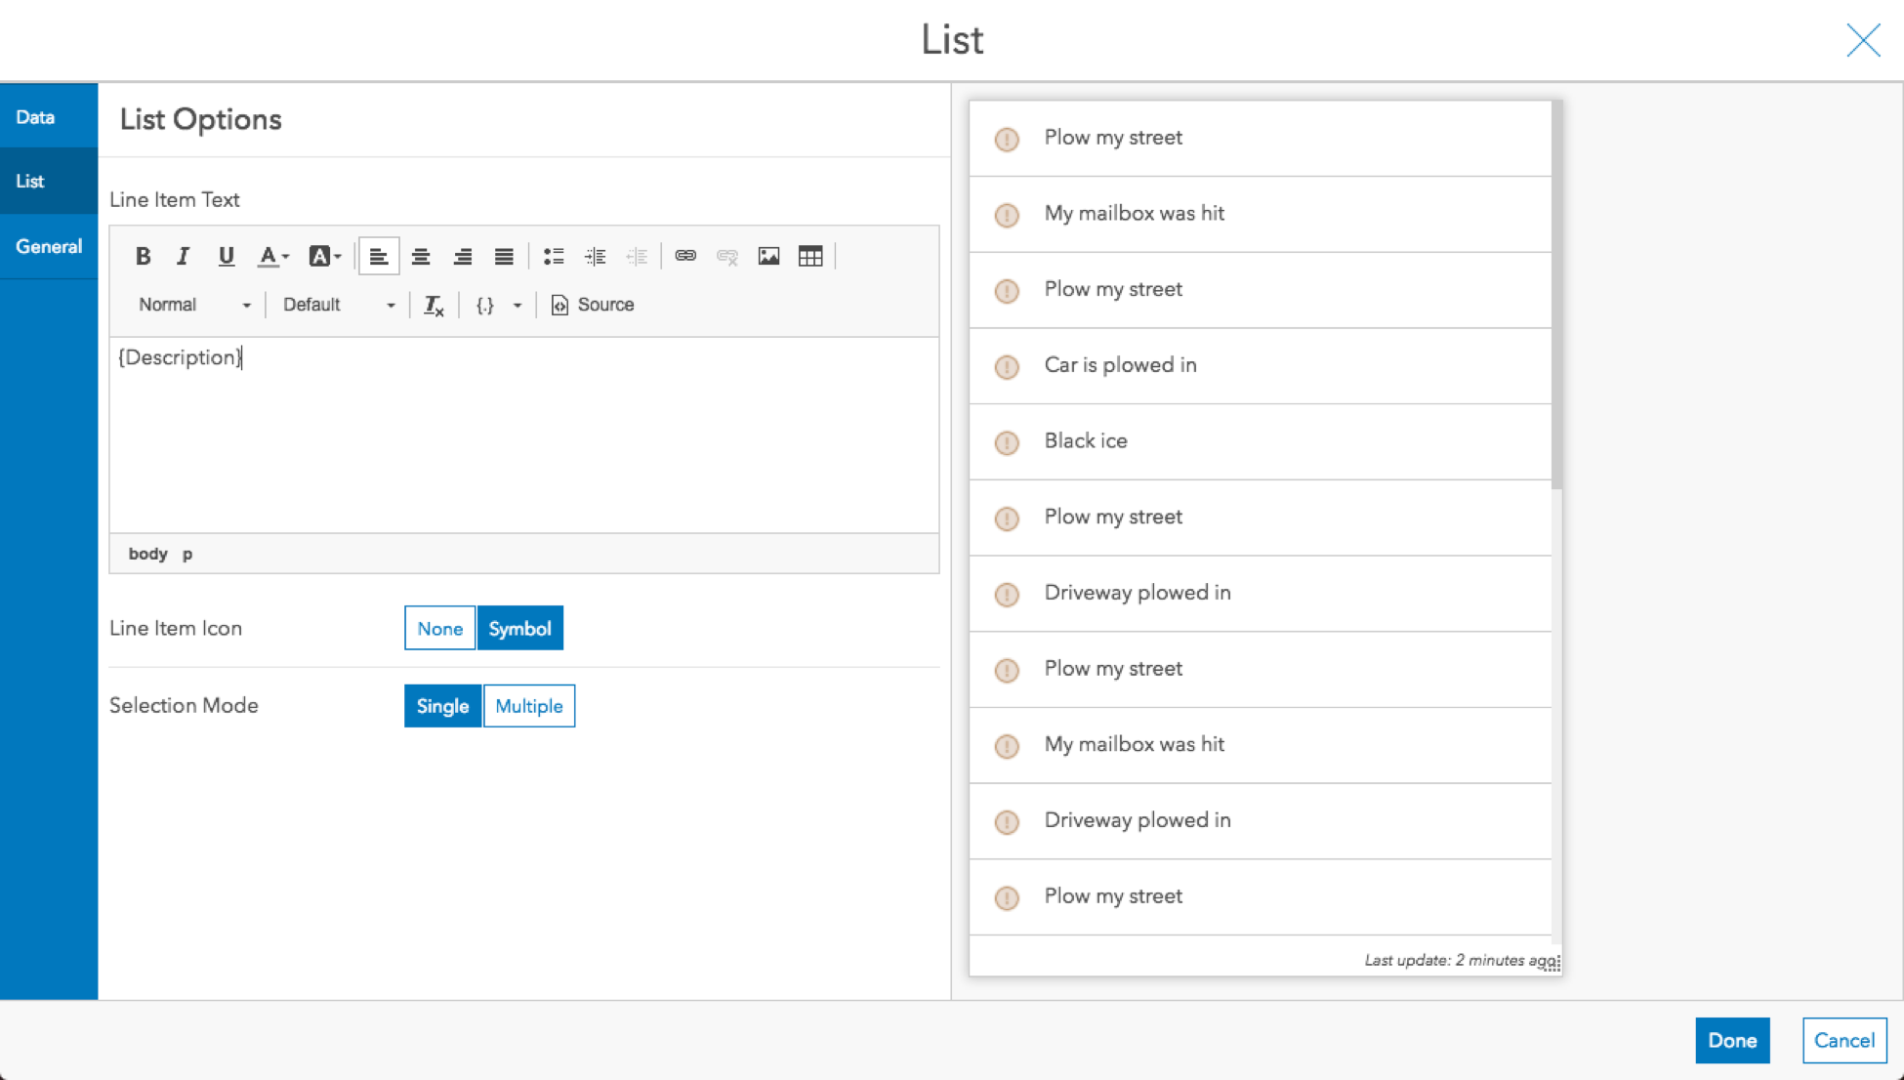
- Press Done to add the List to the dashboard.
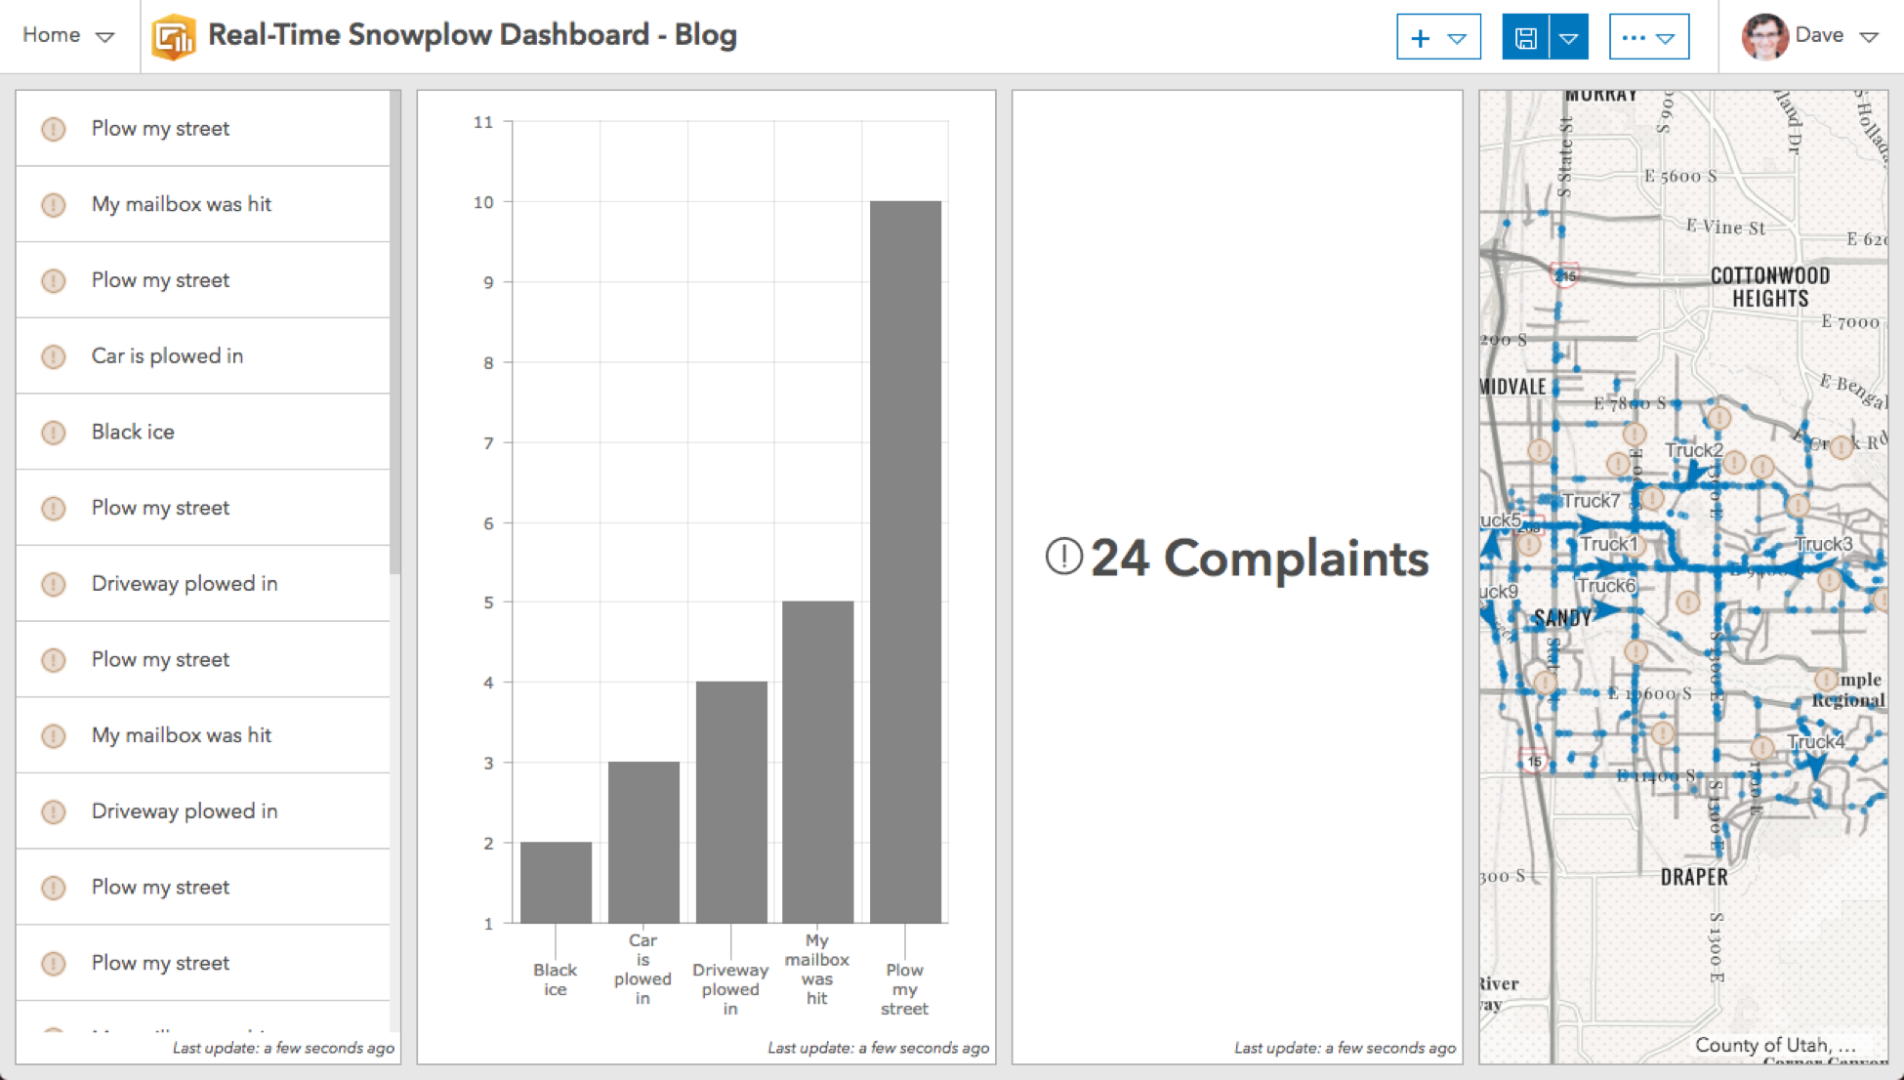
Rearrange the Layout
Now that we have four elements on the dashboard, let’s move them around. Hovering over an element, move your mouse over the blue box in the upper left of the element. In the expanded menu is a drag button. Click and hold this button to move it.
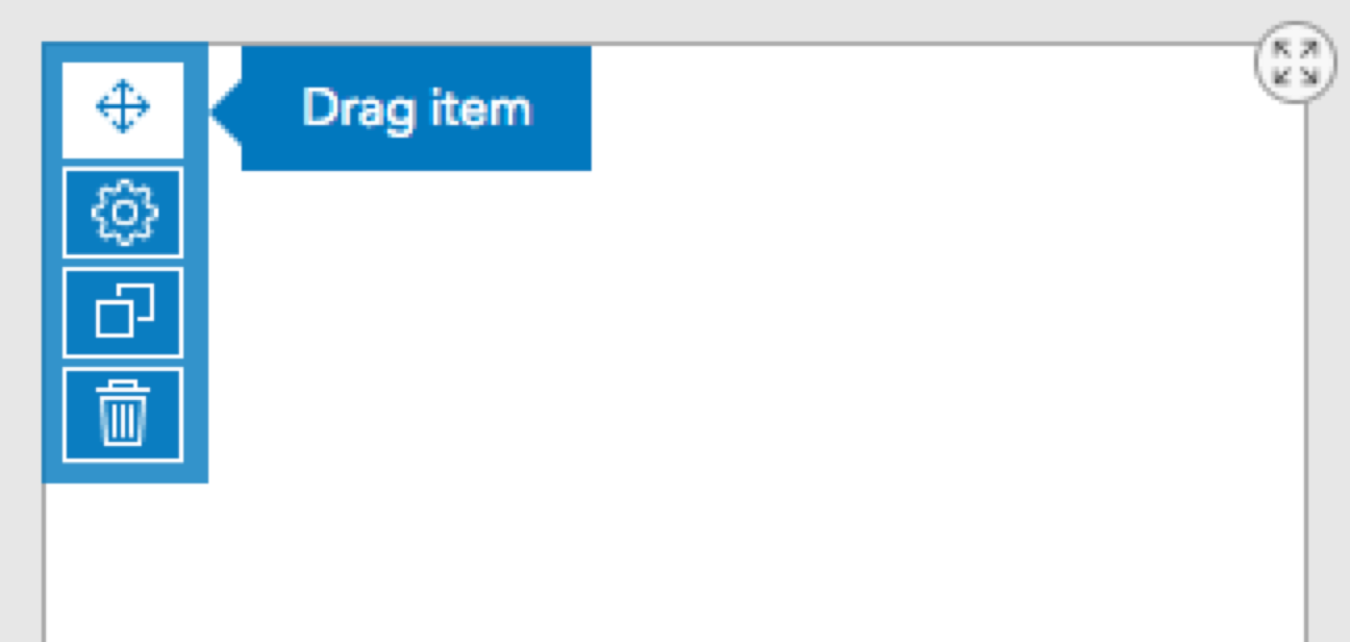
While dragging the element, icons appear at locations where you can dock the element. For more details, read this overview.
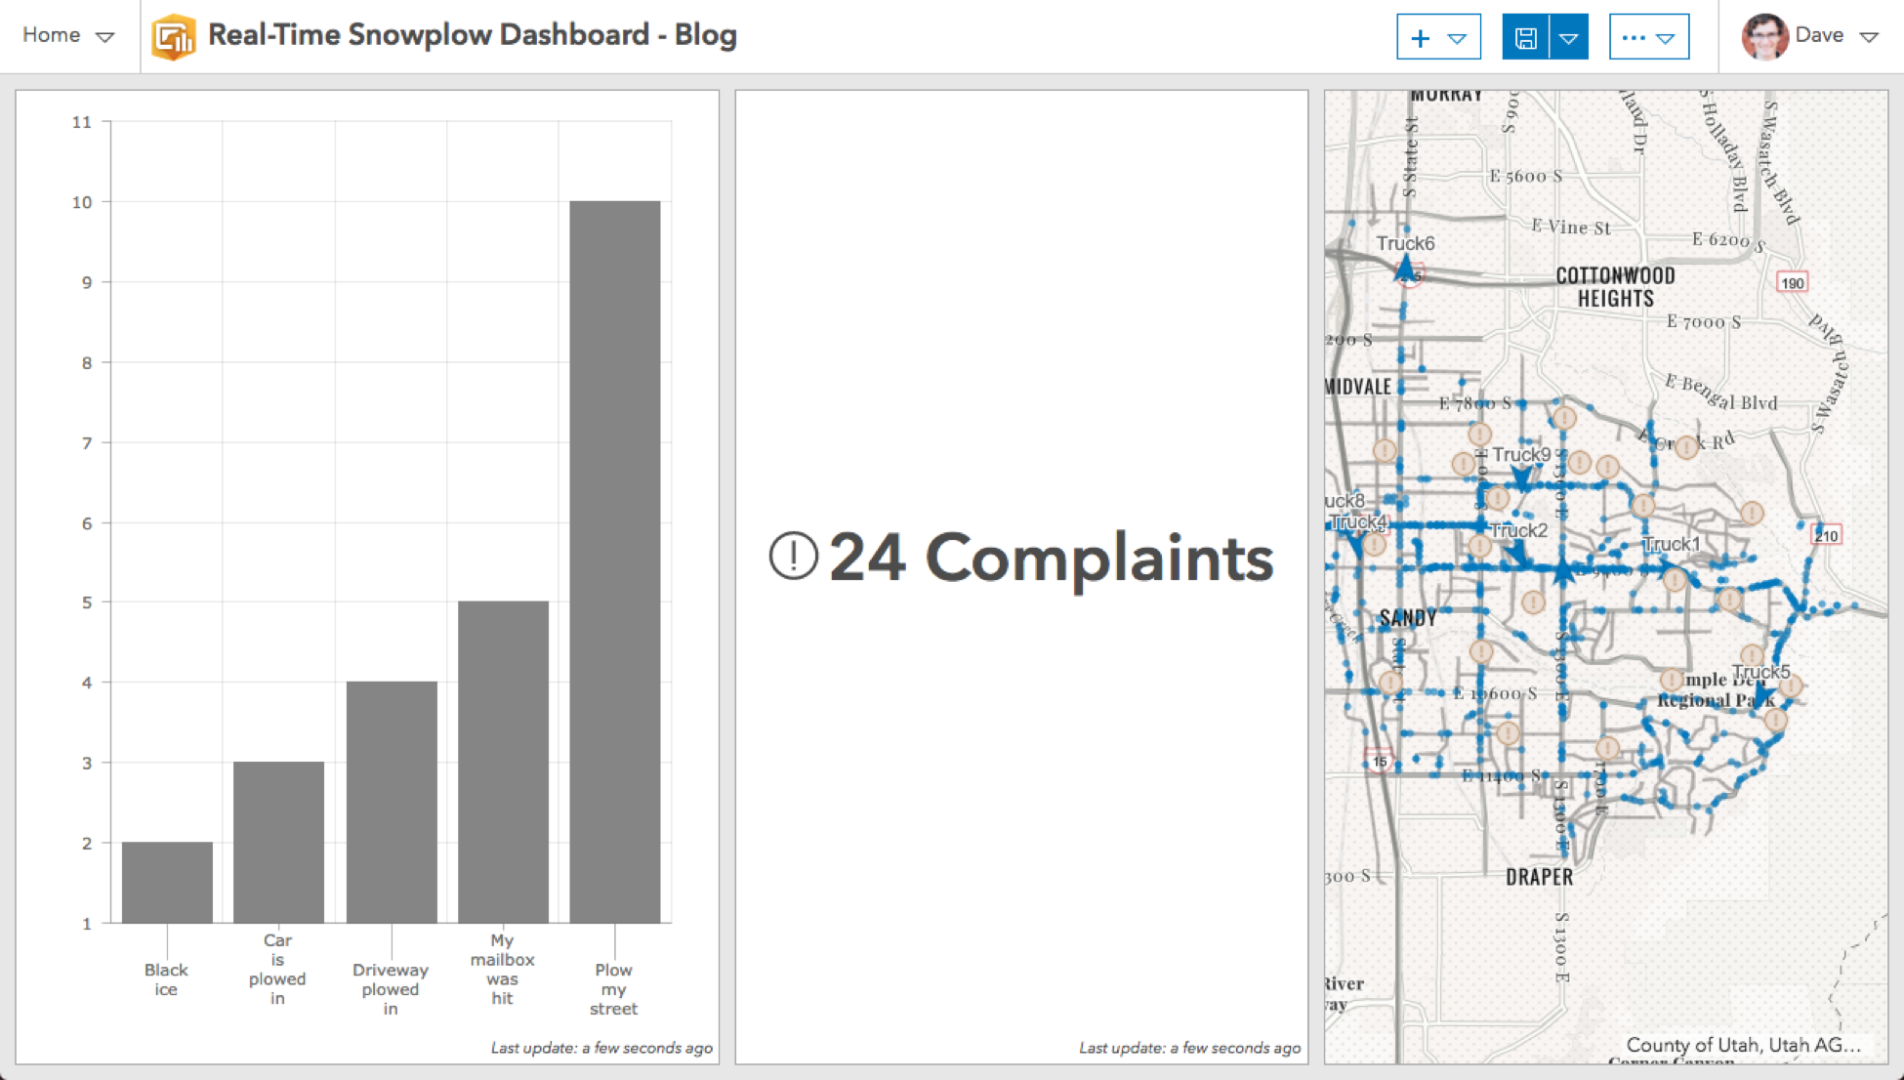
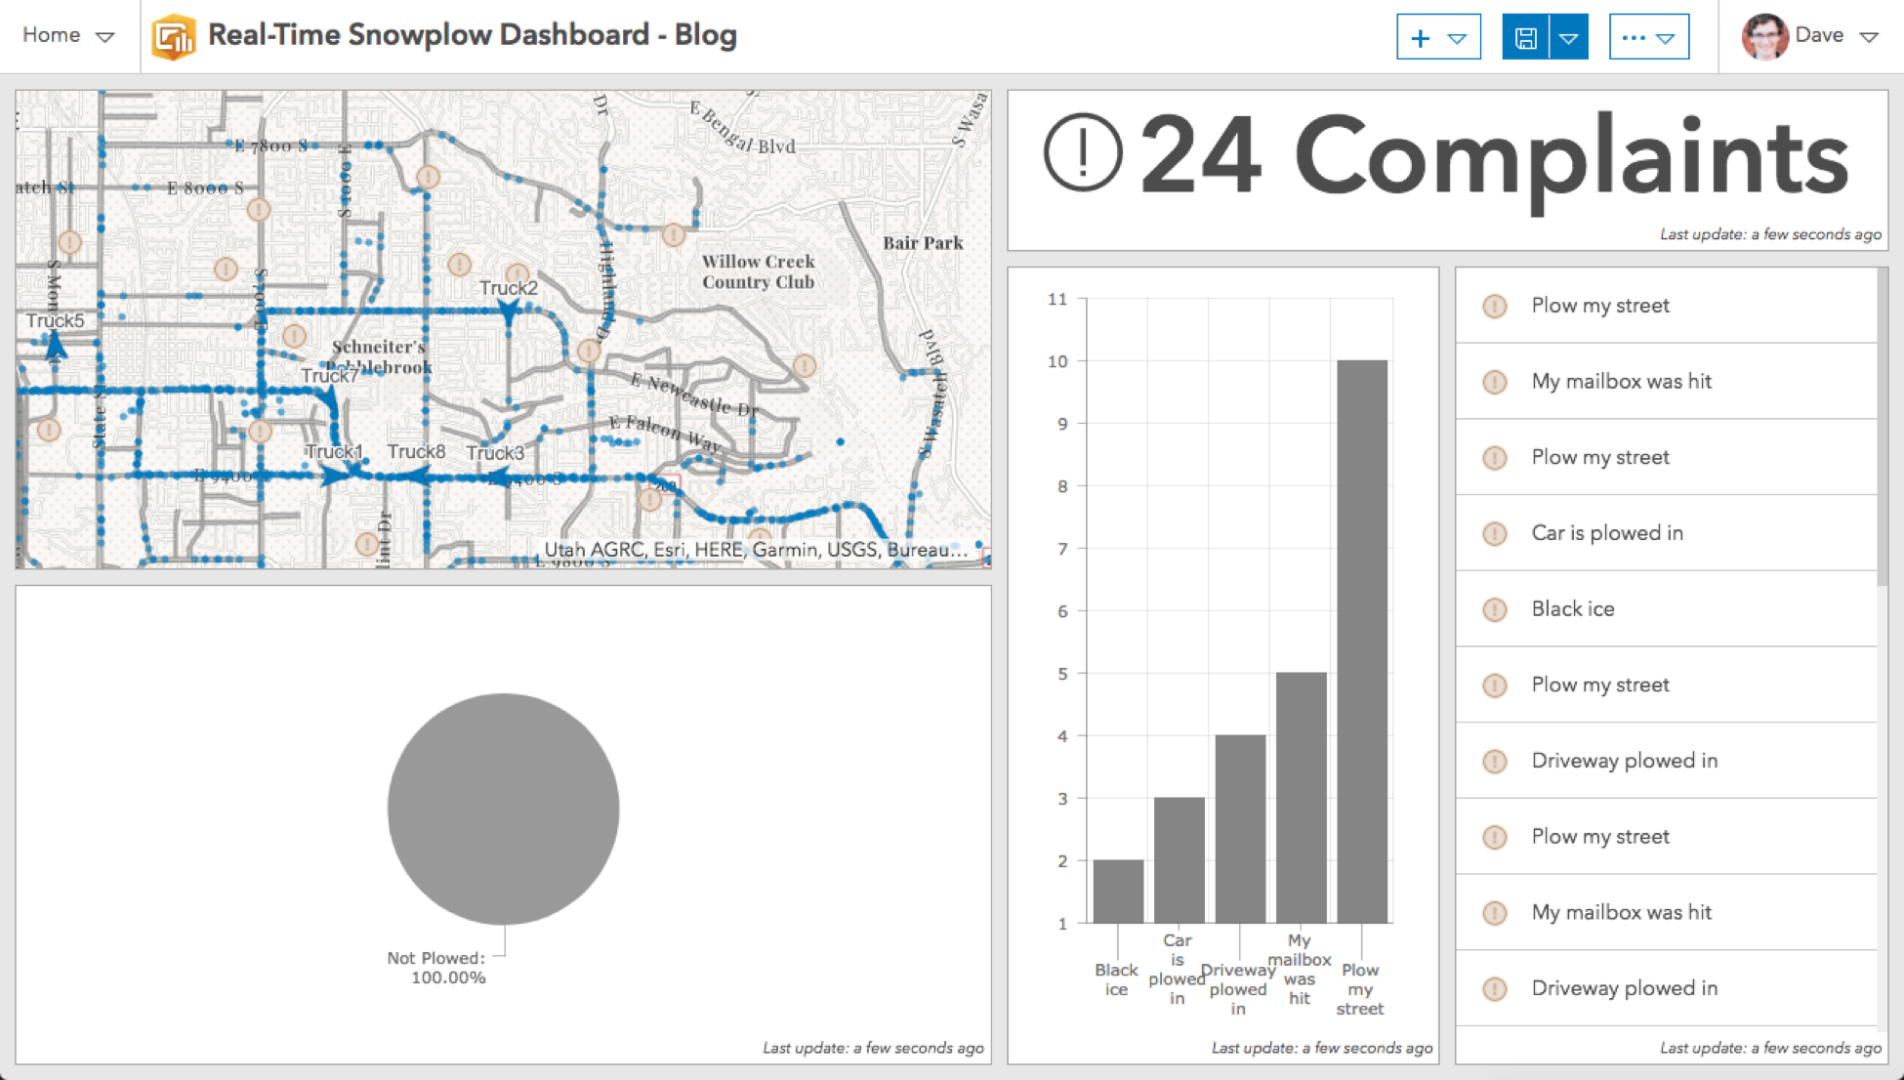
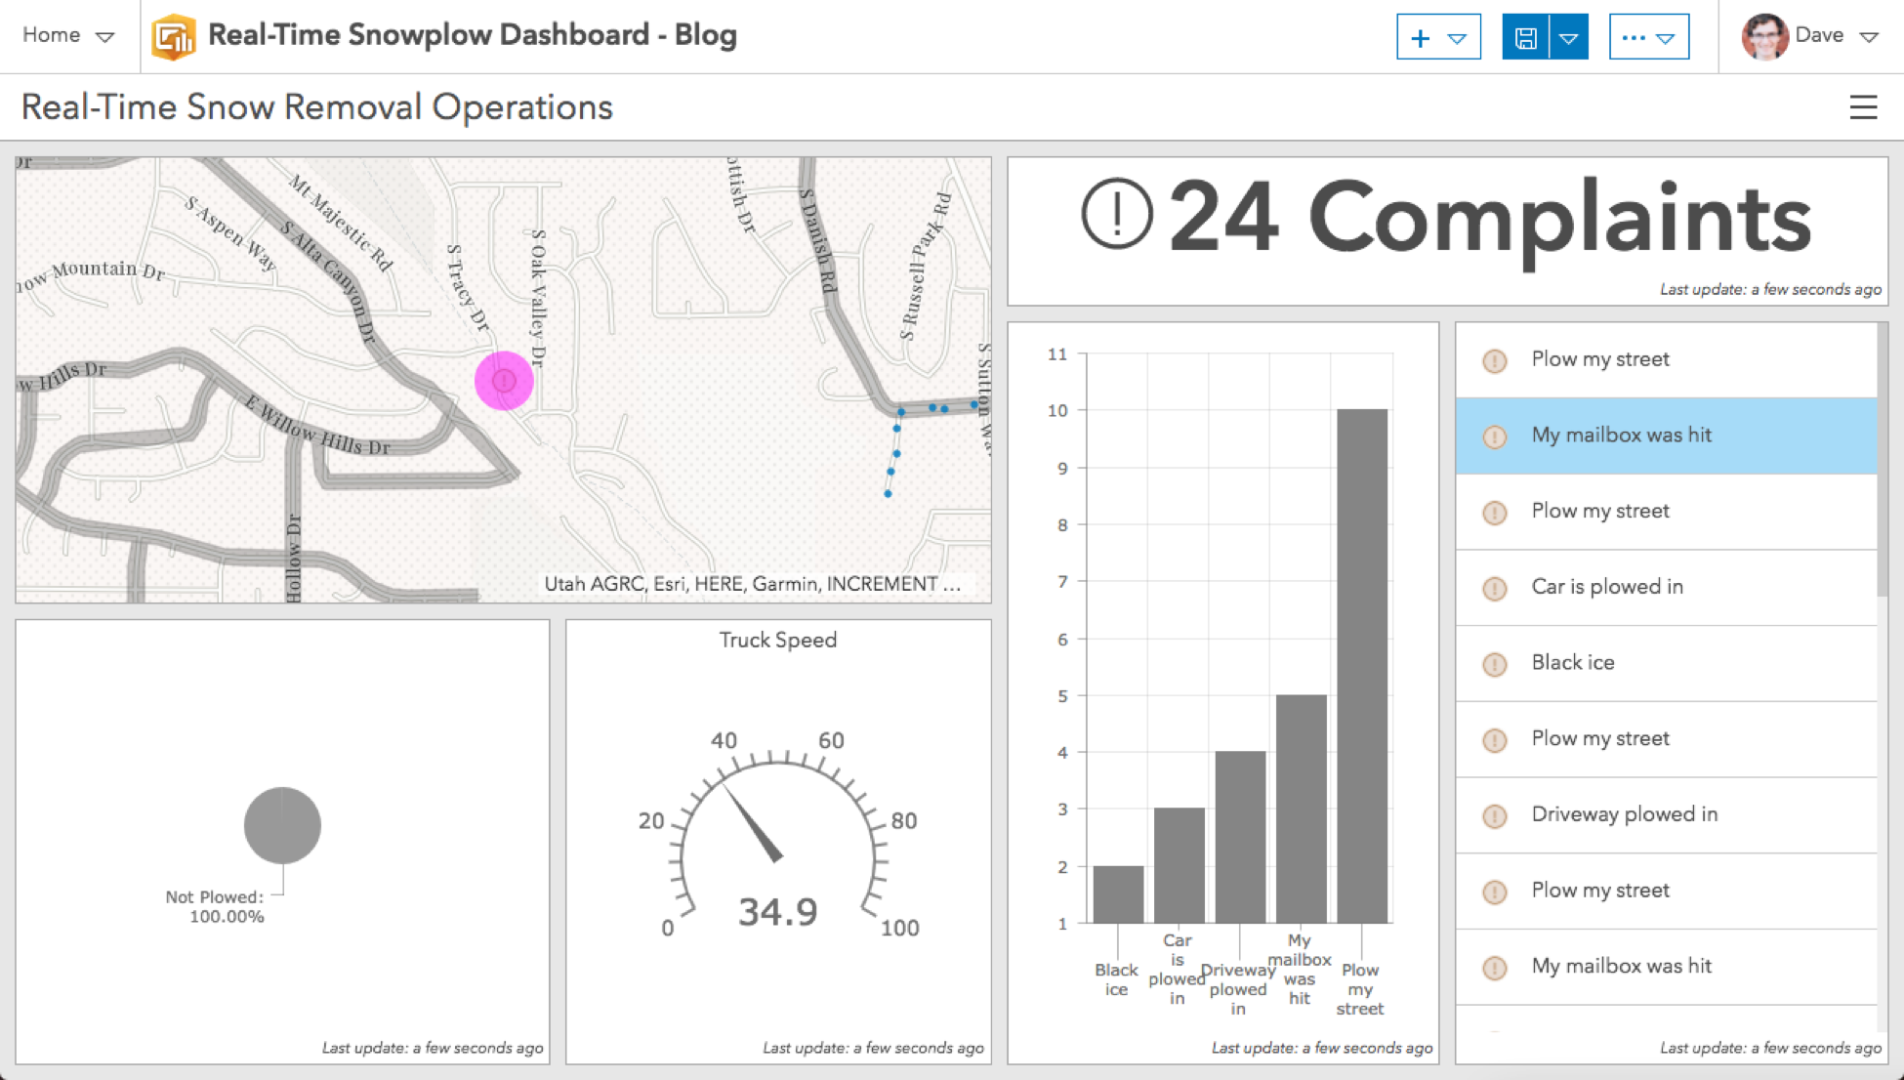
Reposition the elements to resemble the following.
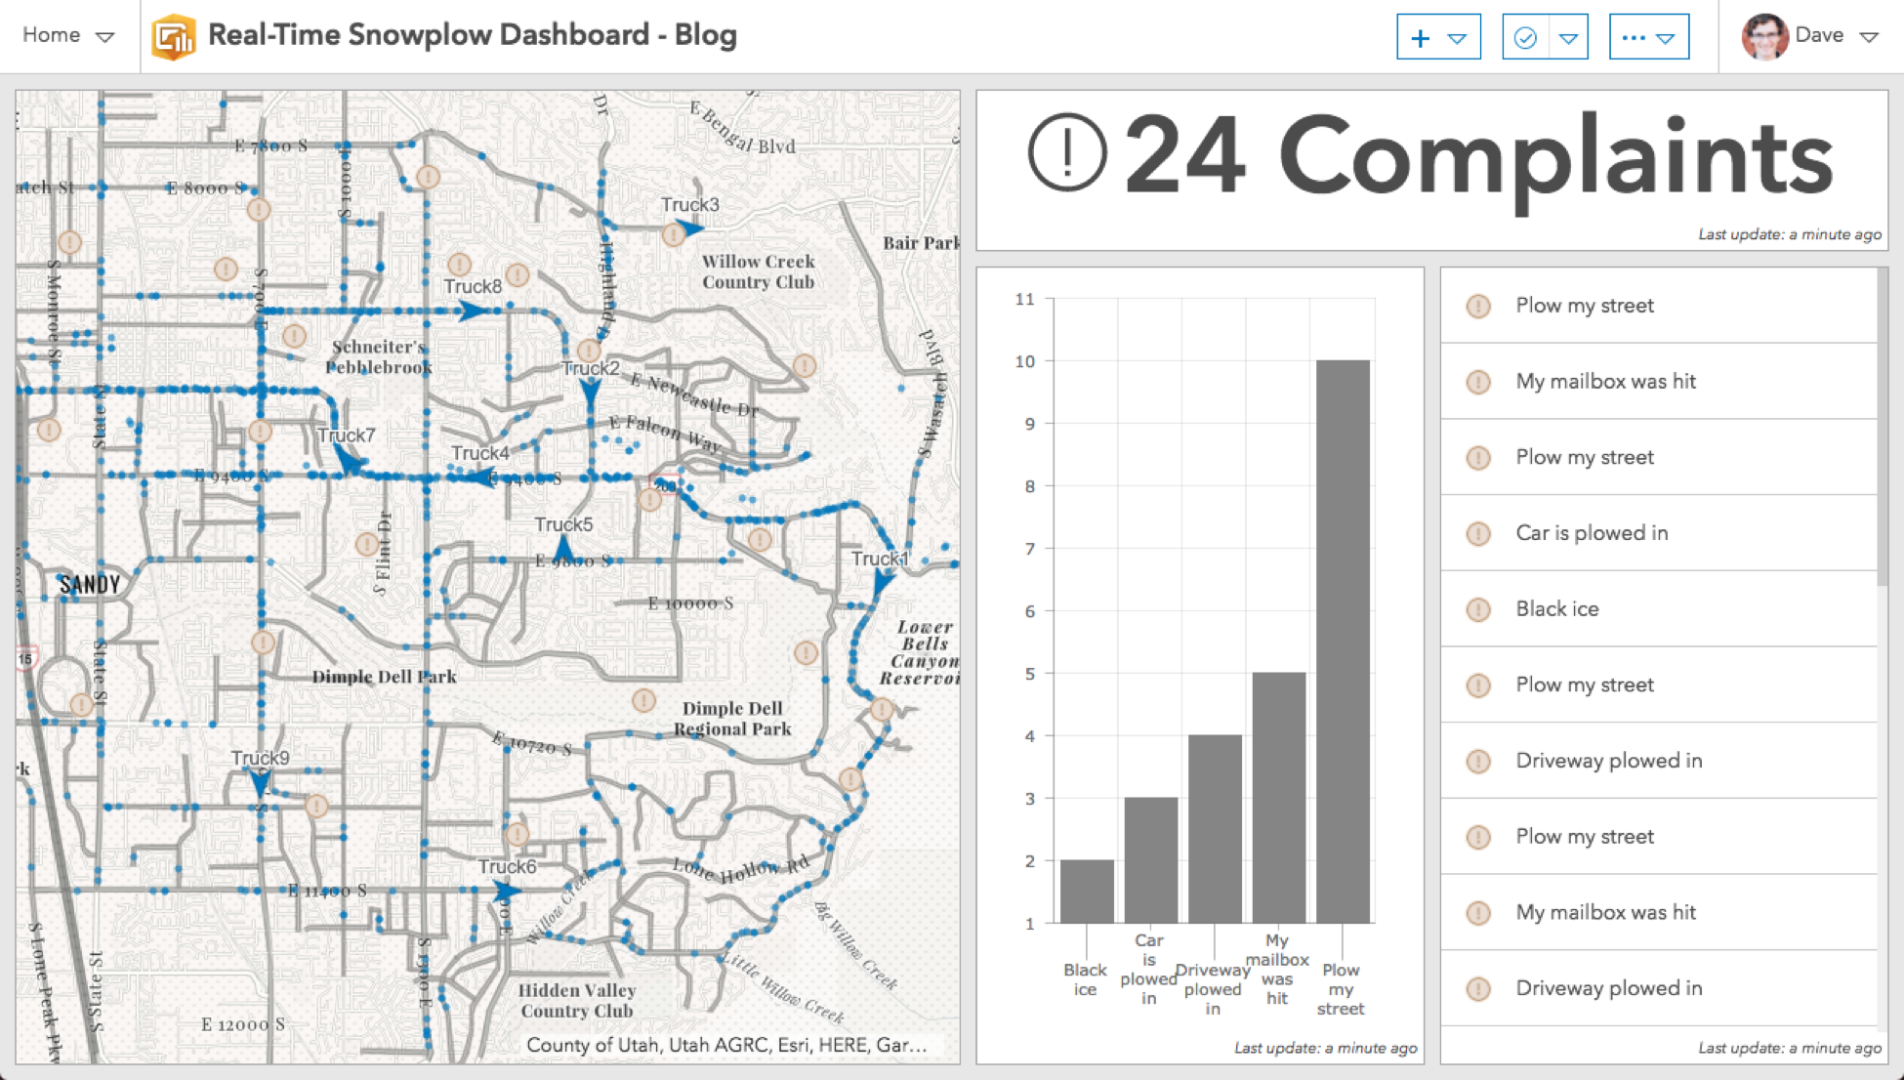
The Dashboard Theme
If you prefer, you can change the theme to Dark Theme using the … button in the navigation panel.
Tip: If you'd like to edit your basemap after changing themes, open your webmap using the Home button in the upper left of the navigation panel and edit it. Consider using one of Esri's excellent vector basemaps.
Here is an example of the dashboard in dark theme using a another version of the webmap, colored to compliment the dark colors of the dashboard.

Map Tools
You can add map tools, such as zoom controls and a legend, by expanding the blue menu in the upper left of the map element and clicking the Configure button. Turn On the following map tools: Default Extent and Bookmarks and Zoom In/Out.
Add More Elements to the Dashboard
Let's continue adding some visual elements to the dashboard.
Pie Chart
A question that users of this dashboard may have is the status of the snow removal operations. We can visualize this with a Pie Chart.
- From the + menu in the navigation panel, choose Pie Chart.
- Choose the Streets Plowed Status layer as the data source.
- Keep the Categories From property on Grouped Values.
- For the Category Field property, choose PlowedStatus. Each street can have a status of “Plowed”, “Not Plowed”, or “In Progress”.
- If we had a field with the length of each street, we would change the Statistic to Sum the lengths. However, in this case, we’ll leave it to show the count of streets by status.
- In the Slices tab, you can define colors for each category.
Note: At the time you create this dashboard, there may only be one PlowedStatus category. You can add the other categories manually by clicking the + Category button and entering the other values.
- Click Done in the footer to add the Pie Chart to the dashboard.
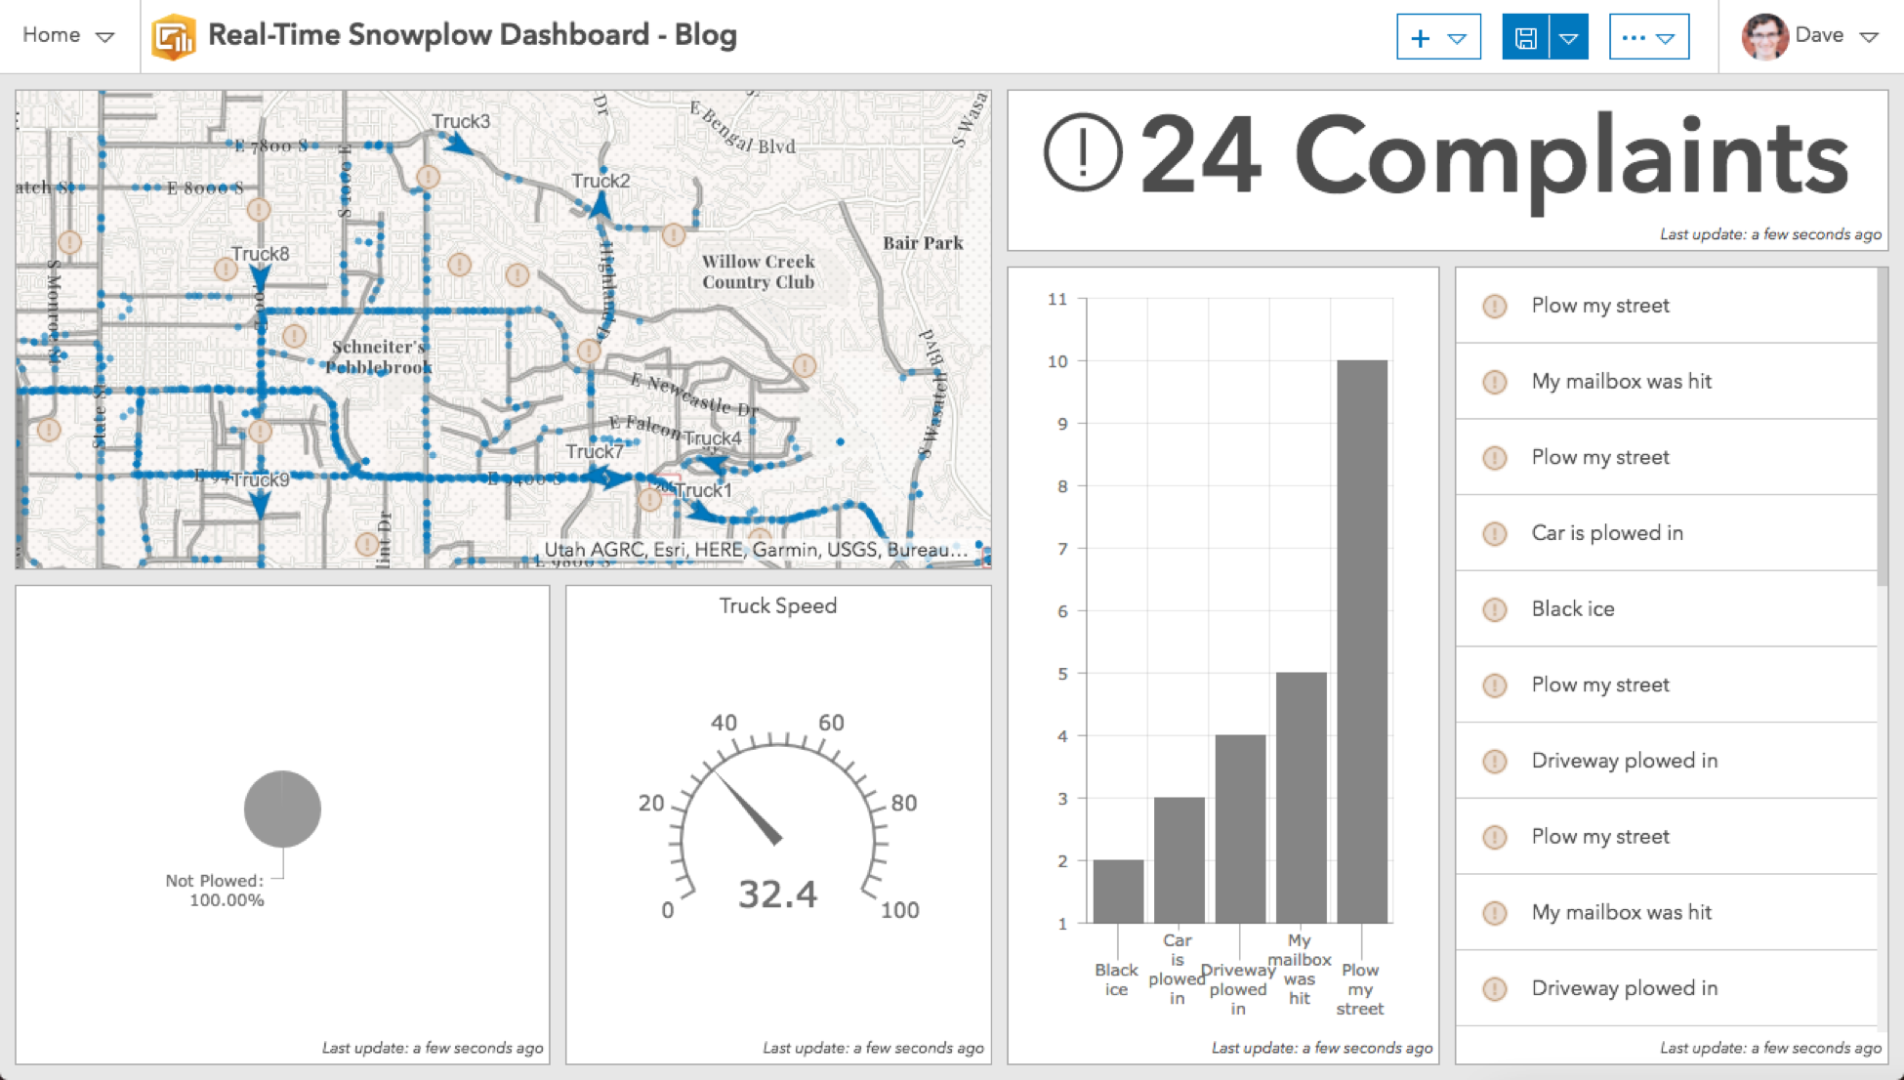
- Reposition it in the dashboard as shown below.
Gauge
We can also show the average speed of the plow trucks. Let’s add a Gauge.
- From the + menu in the navigation panel, choose Gauge.
- Choose the Plows layer as the data source.
- Change the Statistic property to Average and select the speed.
- Under the Gauge tab, choose Meter.
NOTE: More details about the two types of gauges can be found here.
- Under the General tab, in the Title input, enter “Truck Speed” and make it center justified.
Tip: Under the Gauge tab and Guides section, click + Guide to add a color band to the gauge. Define the range with either a value or a percentage. Guides can be used to indicate ranges that are OK and dangerous.
- Click Done in the footer to add the Gauge to the dashboard.
- Reposition it in the dashboard as shown below.
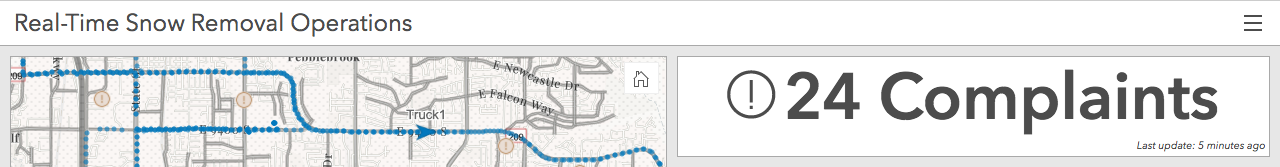
Add a Header and Title
The title you see on the top of the dashboard is only visible to you, because you are in edit mode. Let’s add a Header with a title for our users.
- From the + menu in the navigation panel, choose Header.
- In the Title property, enter “Real-Time Snow Removal Operations”.
- Turn off the Header Margin
- Click Done in the footer to add the Header to the dashboard.
Add Interactivity
Let’s add some interactivity to this dashboard.
Zoom Action
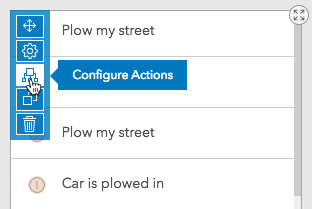
It would be nice to zoom the map to a complaint when one is clicked in the list.
- Expand the menu in the upper left of the List and choose Configure Actions.
- When a selection is made or changes, you want to zoom the map to the feature. From the Add Action menu, choose Zoom.
- From the Add Target menu, choose your map.
- We can also flash the feature on the map. Add a Flash action and again target your map.
- Click Done in the footer and test out the interaction.
Filter to a Single Truck
We can also add a dropdown to our header that allows the user to filter the map to display only one truck at a time. This is done by adding a Selector.
- Expand the menu in the upper left of the Header.
- Choose Add Category Selector.
- In the Title input, enter “Truck Filter”.
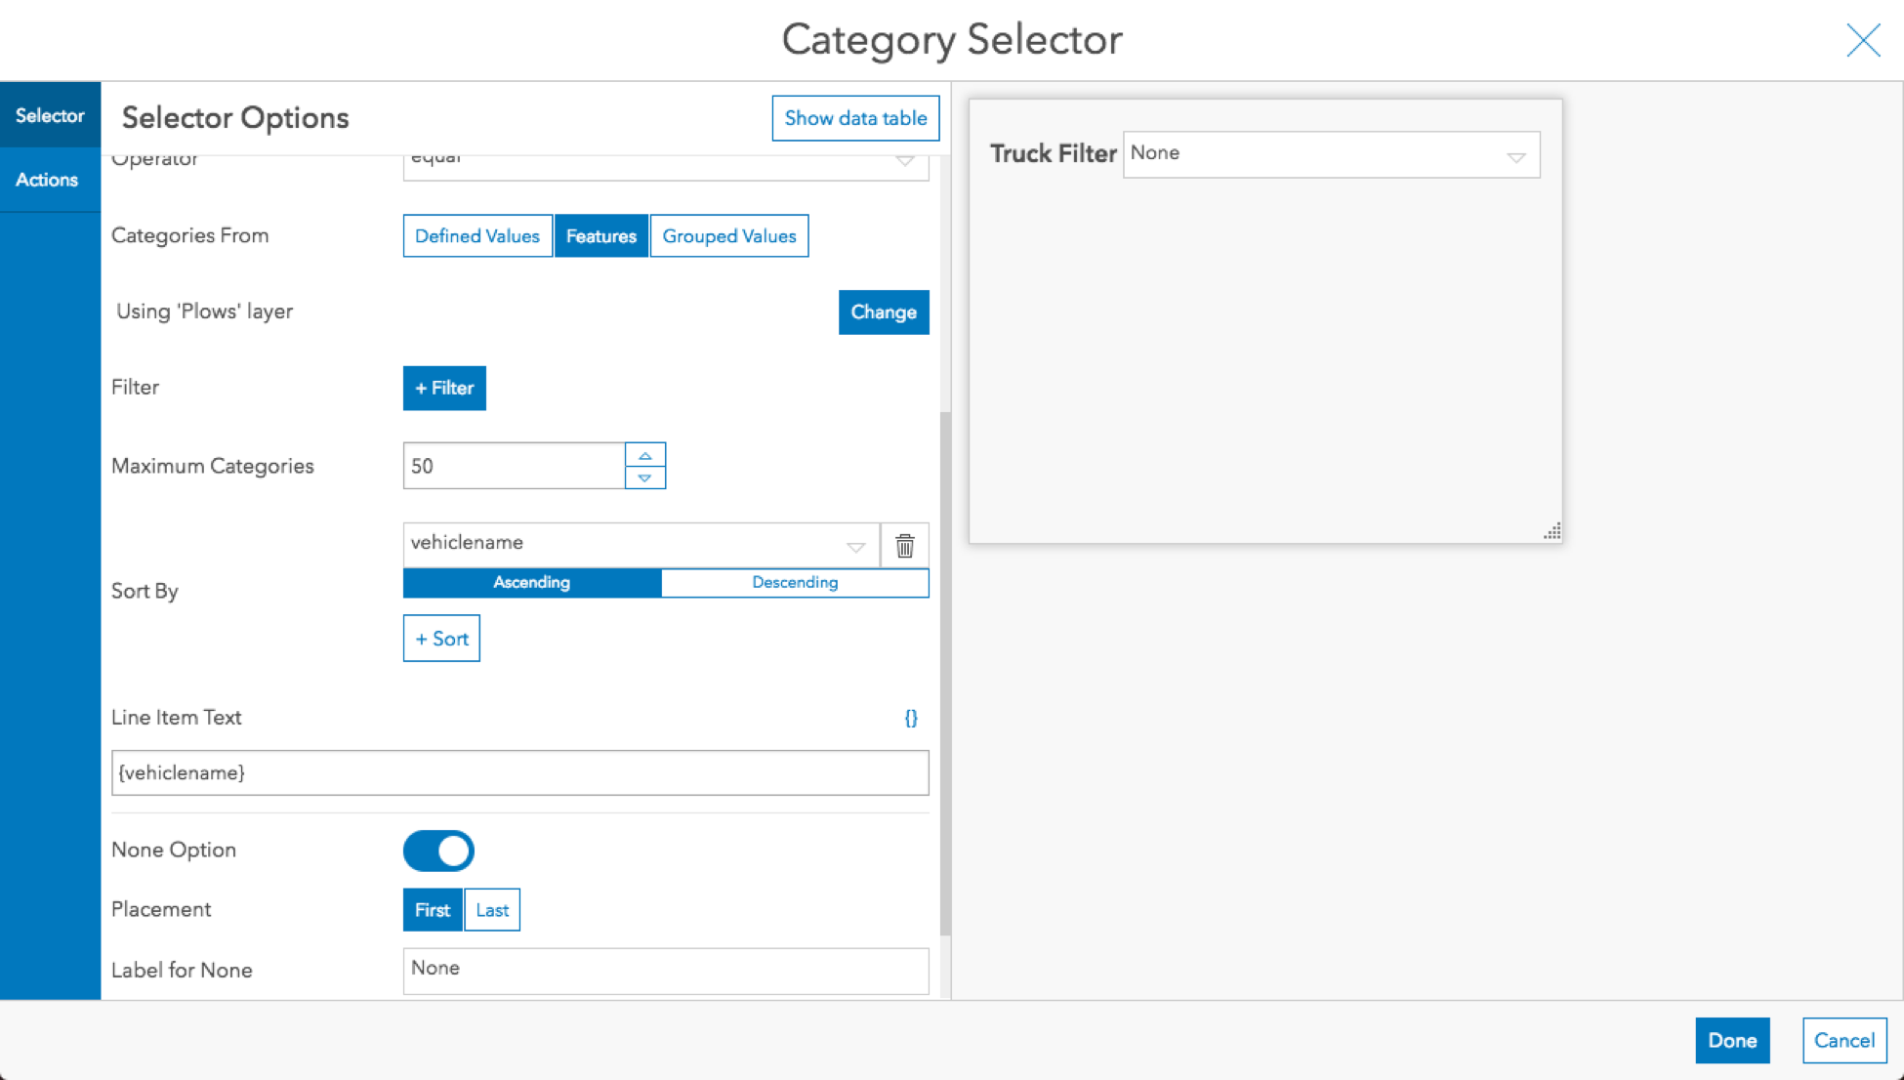
- For the Categories From property choose Features.
- Choose the Plows
- To the right of the Sort By property, click + Sort. Choose vehiclename and Ascending.
- In the Line Item Text input, using the {} dropdown add “{vehiclename}”.
- Turn On the None Option.
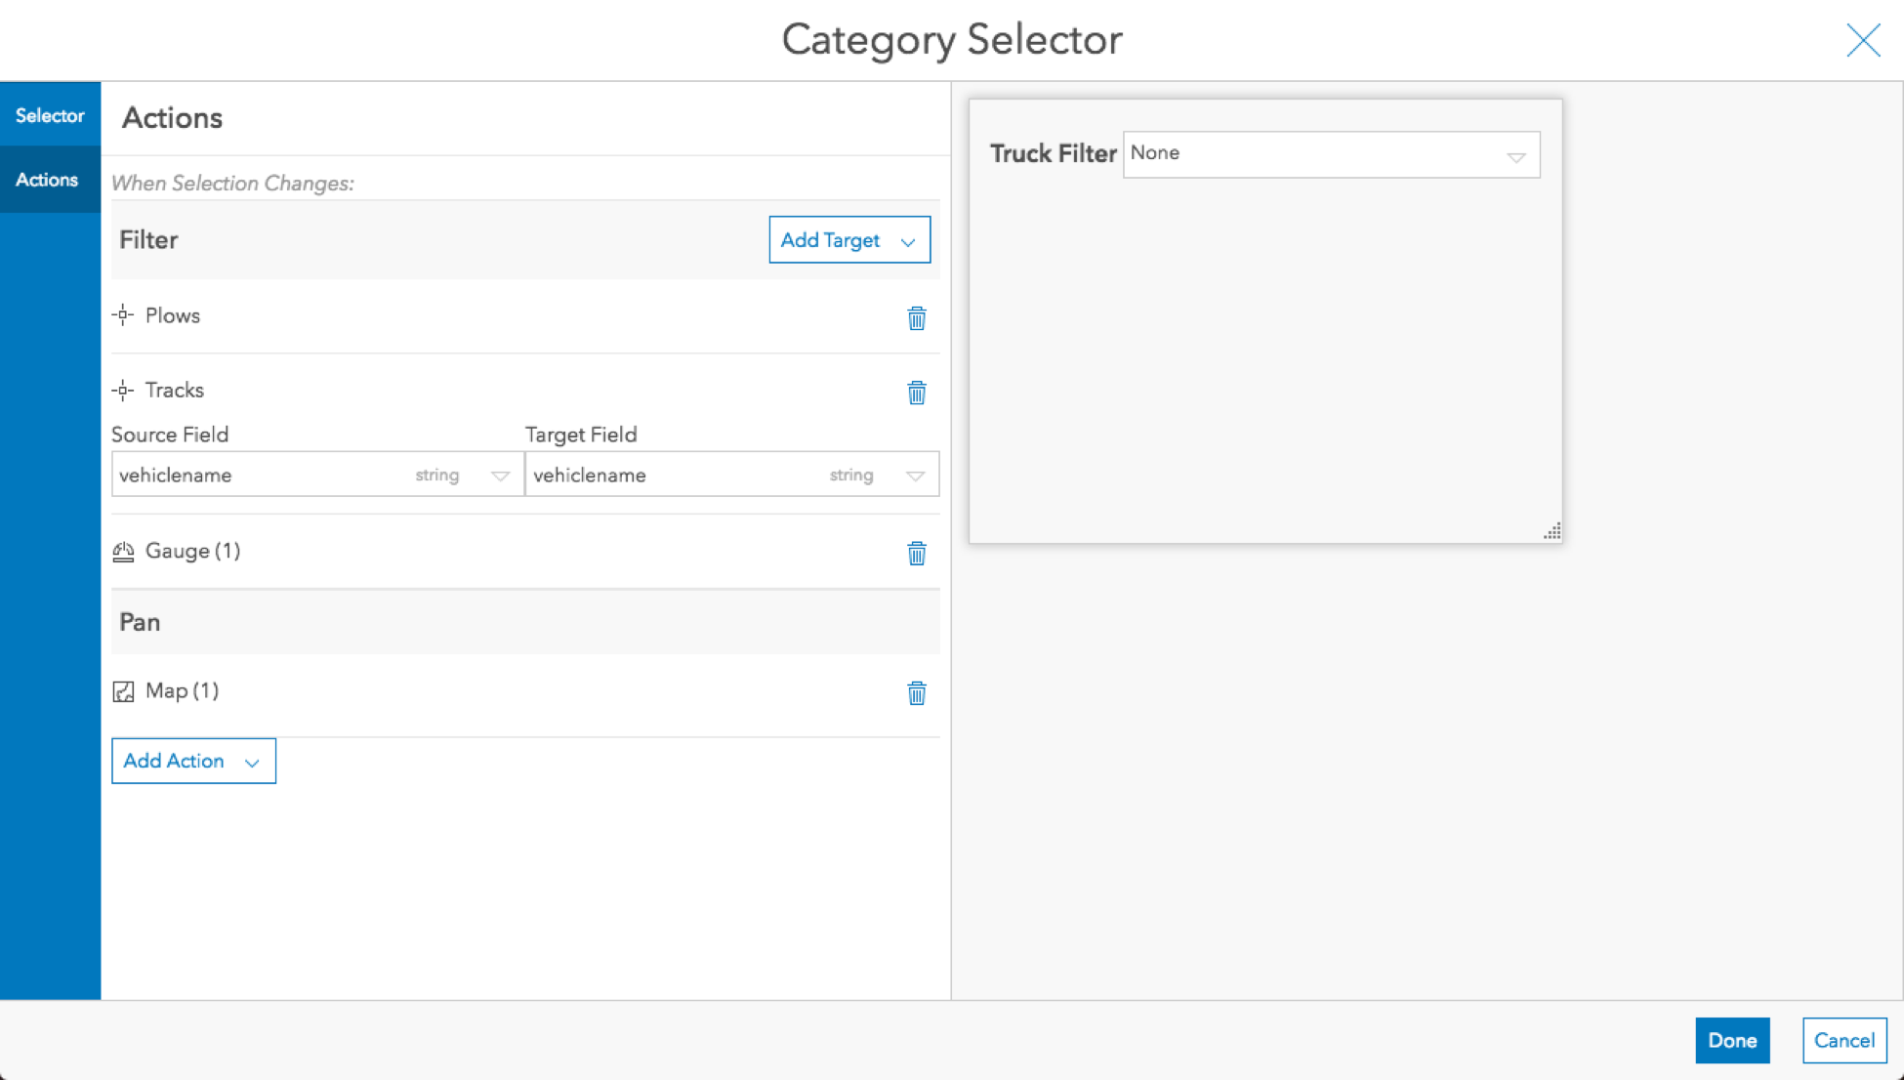
- In the Actions tab, add a Filter action from the Add Action menu.
- In the Add Target menu indented under the map, choose the Plows layer and Tracks layer. Also add the gauge Gauge (1).
- Under the Tracks layer properties, choose vehiclename for both the source field and target field.
- Also add a Pan action from the Add Action menu.
- Choose your map from the Add Target menu. It should look like the following.
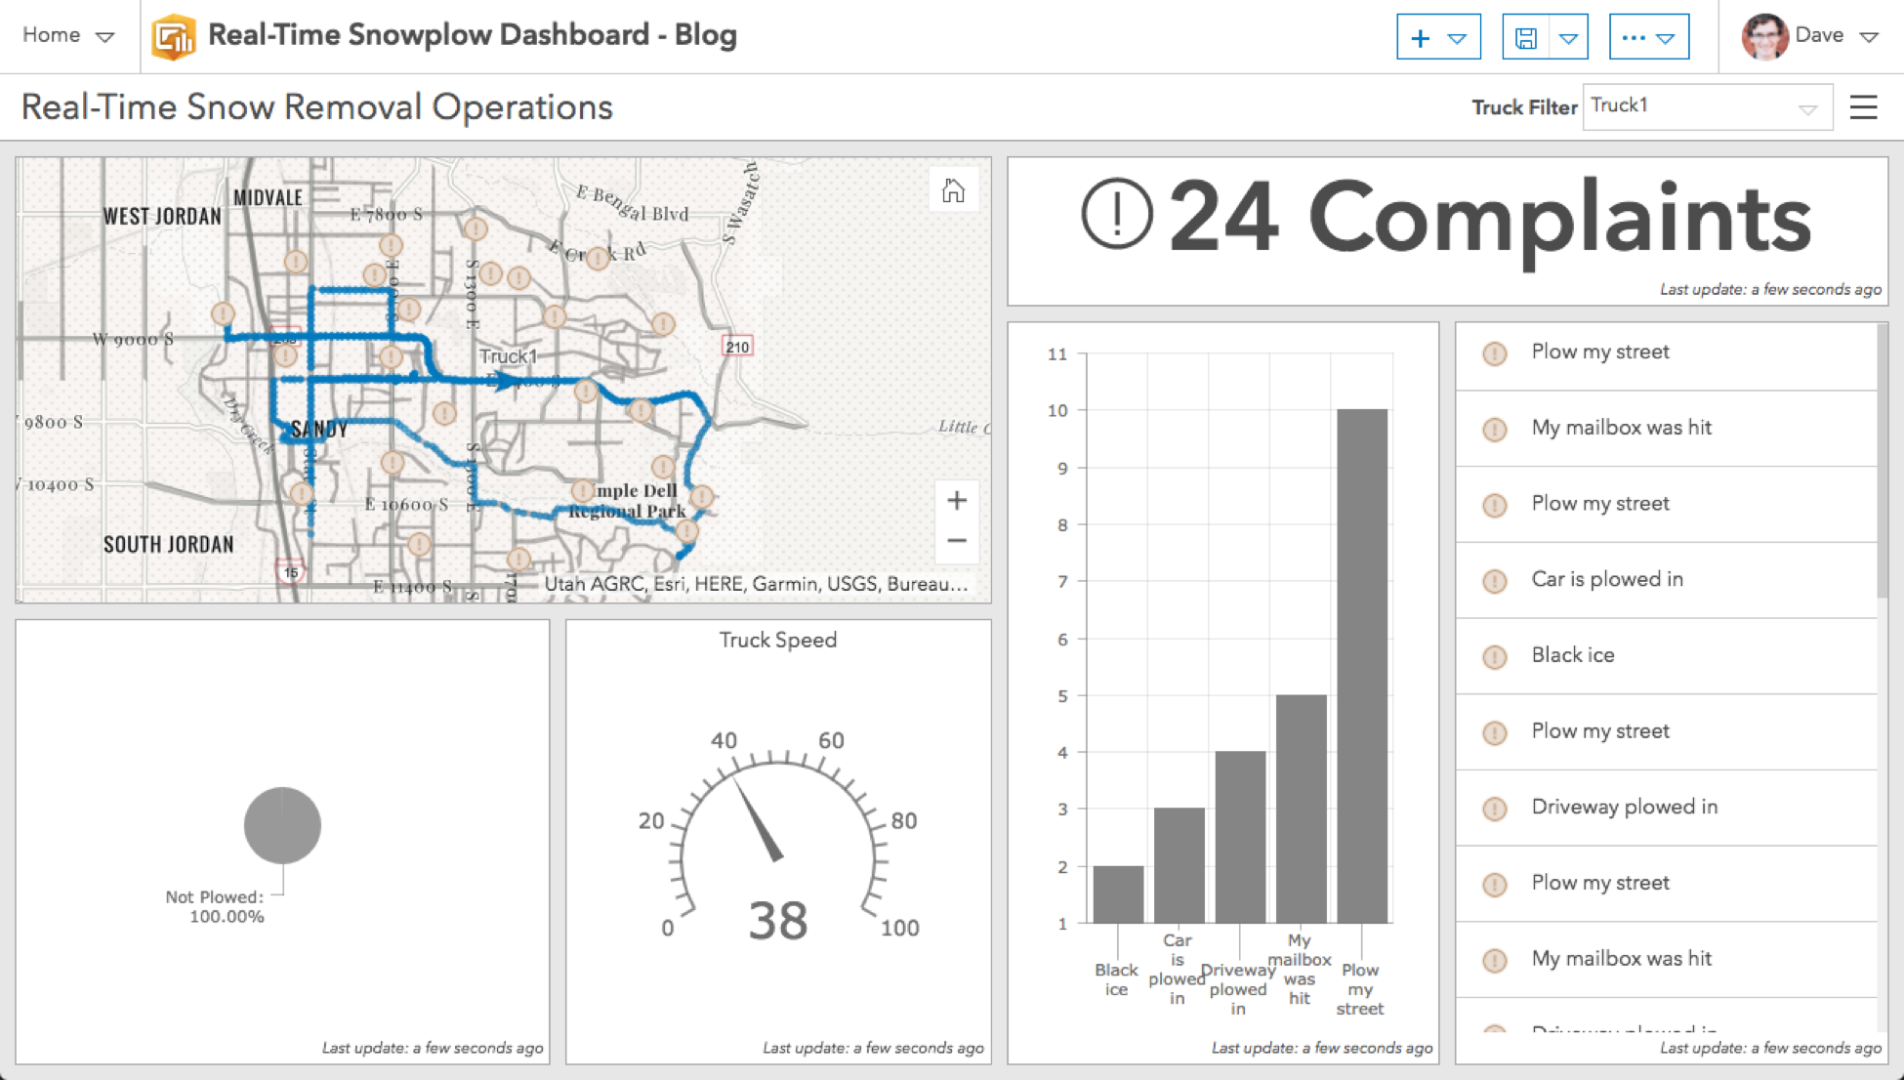
- Click Done in the footer to add the selector.
- Interact with the selector to filter the Plows layer and Tracks layer on the map as well as the gauge.
Trim Vehicle Tracks to a Time Window
Showing all the tracks isn’t always helpful. Let’s add another Date Selector that lets the user trim the vehicle tracks to various time windows.
- Expand the menu in the upper left of the Header.
- Choose Add Date Selector.
- In the Title input, enter “Vehicle Tracks for Last”.
- Under the Defined Categories section, for the Display Type property choose Button Bar.
- Under the Display Type property, click the + Add
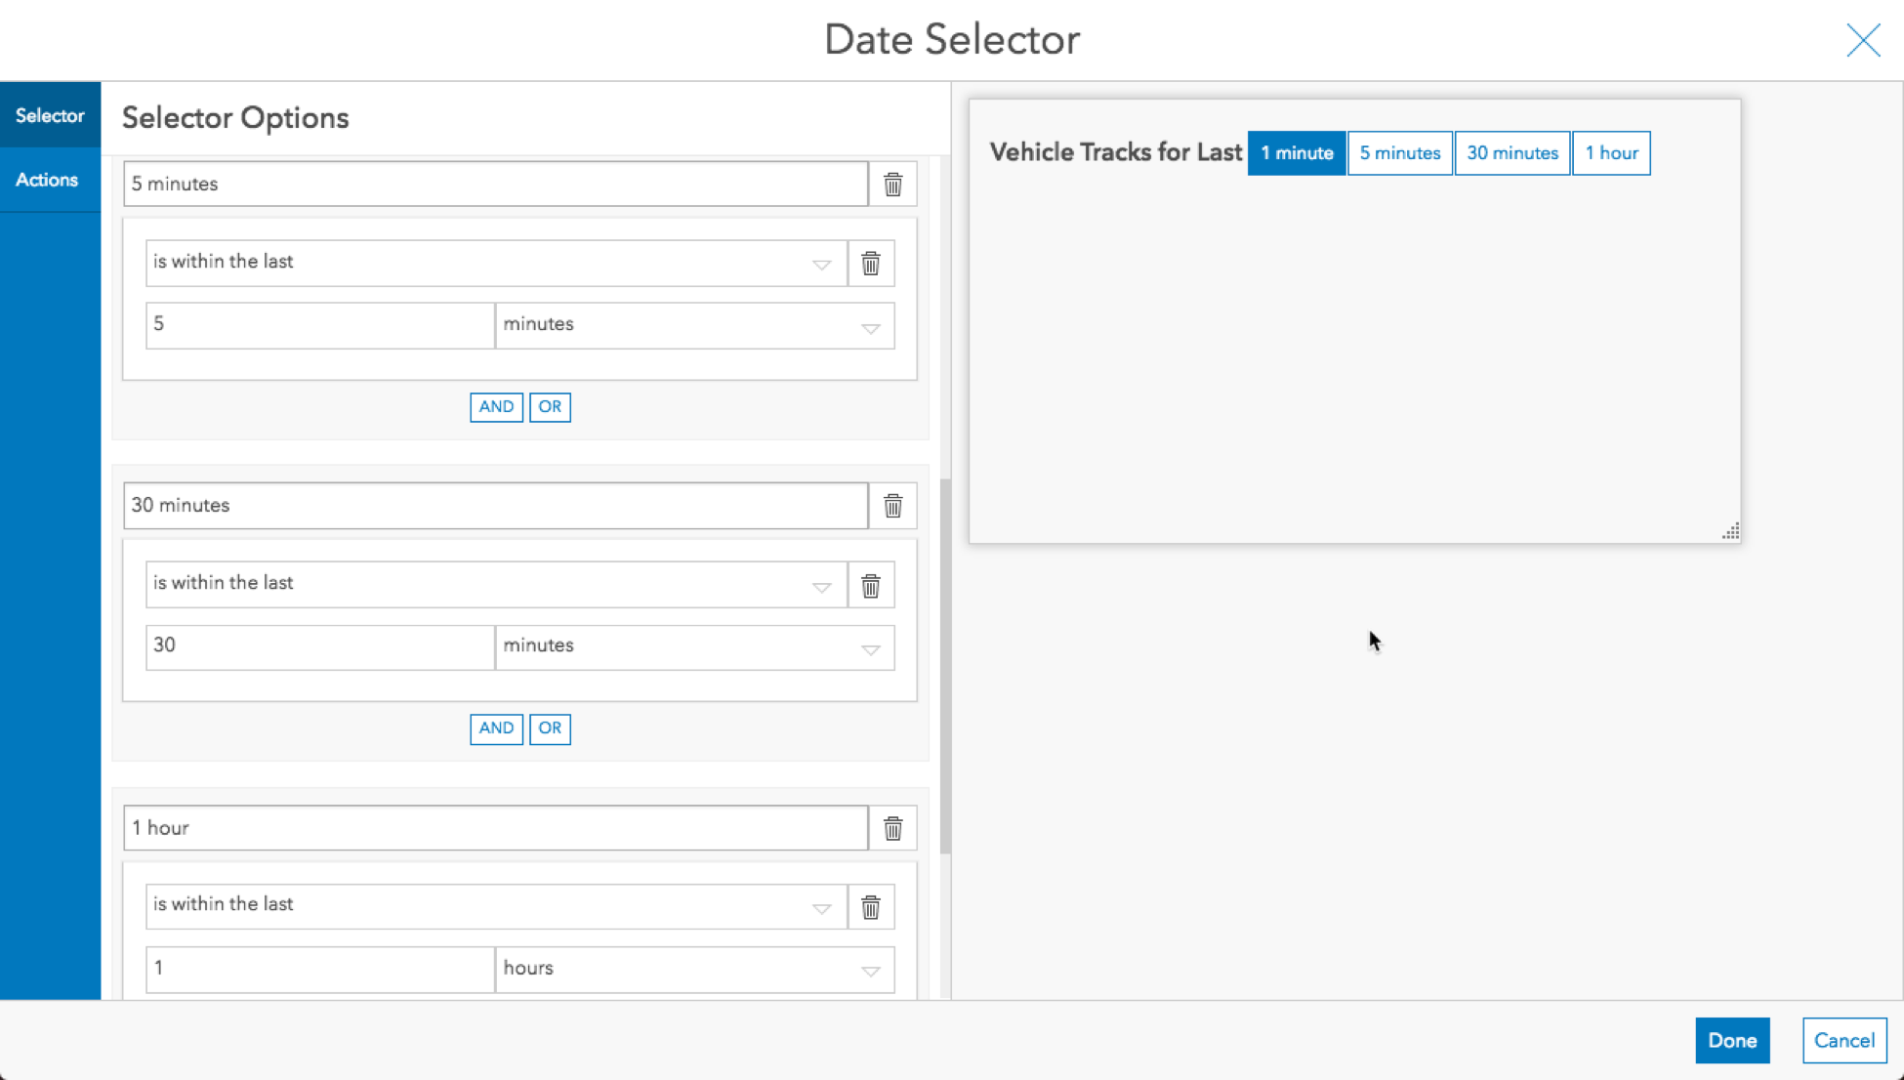
- In the Enter Display Name property, enter “1 minute”.
- Click the Select an operator dropdown and choose is within the last.
- Leave the value as 1. Click the units dropdown and change it from days to minutes.
- Repeat steps 5 through 8 for “5 minutes”, “30 minutes”, and “1 hour”.
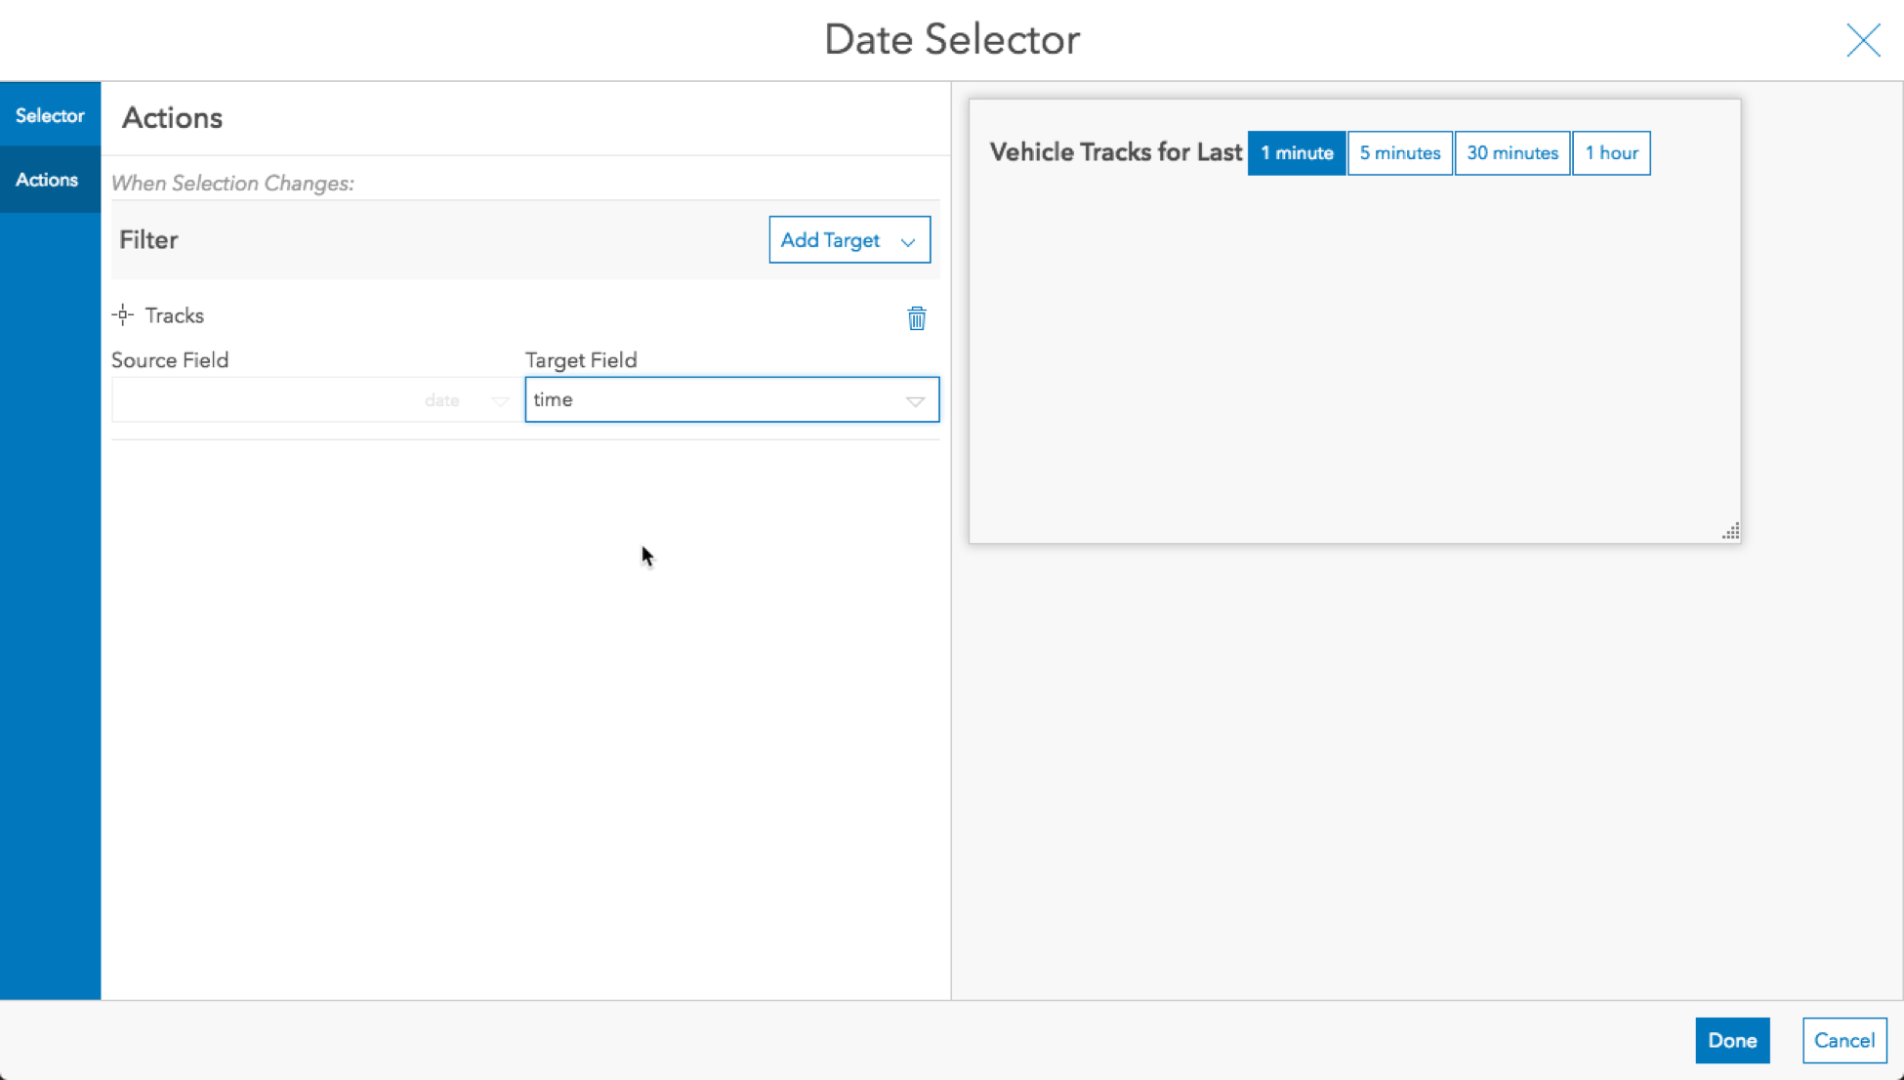
- In the Actions tab, add a Filter action from the Add Action
- In the Add Target menu indented under the map, choose the Tracks
- Under the Tracks layer properties, choose time for the Target Field. It should look like the following.
- Click Done in the footer to add the selector.
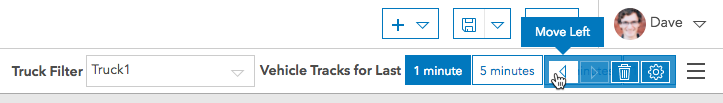
- Move the Date Selector left by hovering over it and expanding the menu on the right.
- Interact with the selector to filter the Tracks layer on the map.
Conclusion
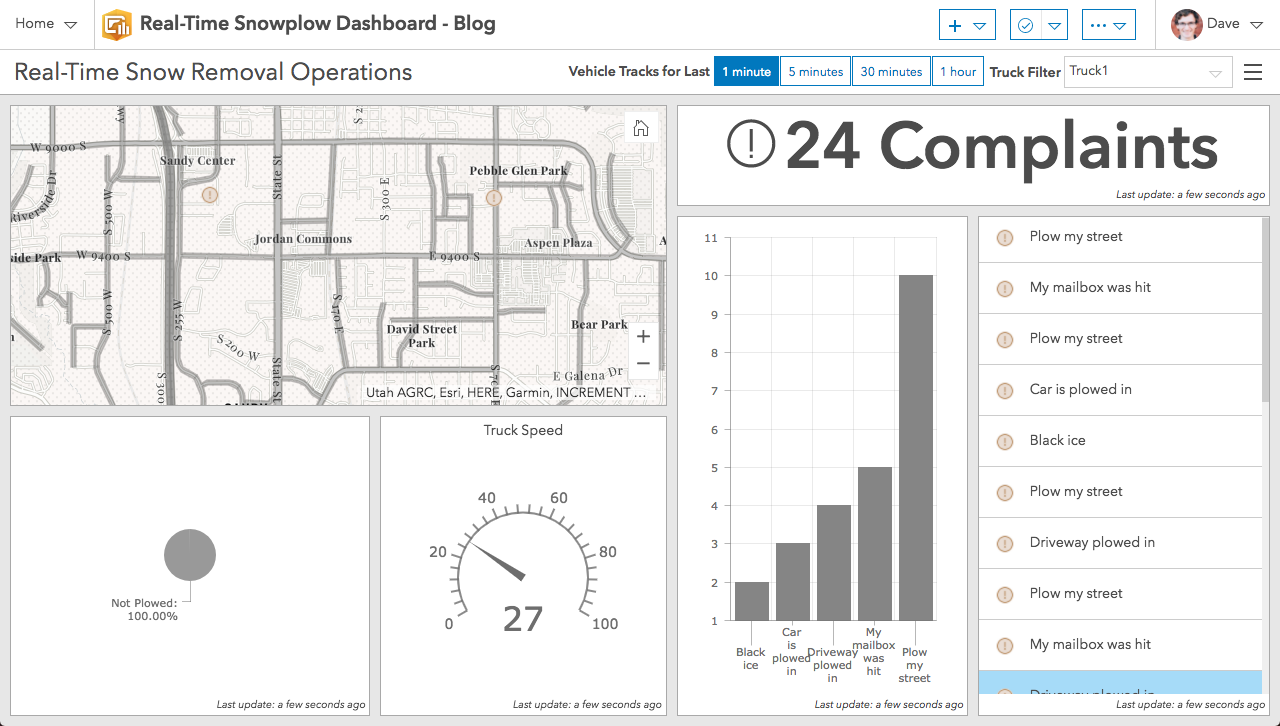
You did it! You created an impressive real-time dashboard with Operations Dashboard for ArcGIS. Feel free to customize the colors and aesthetics some more. Your dashboard should look similar to this live sample.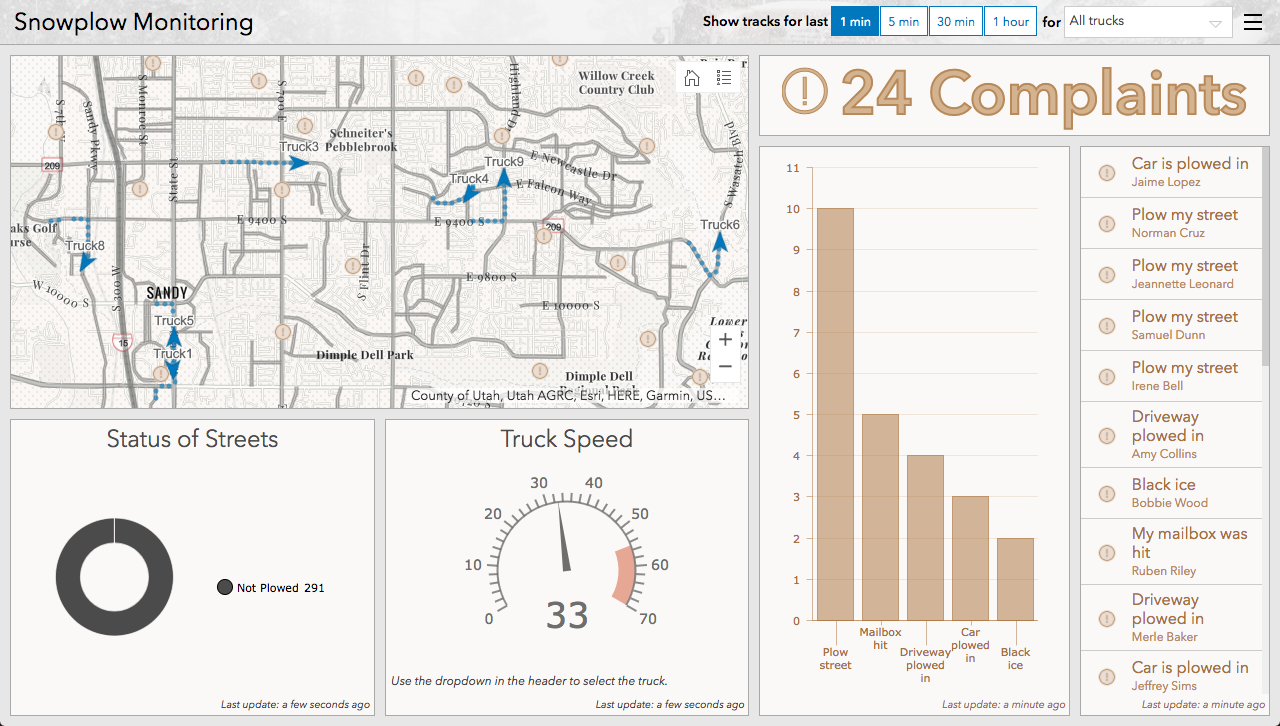
From the dashboard users can easily answer the questions we discussed at the beginning:
- How many current complaints are there?
Hint: See the Indicator and Serial Chart. - How many streets have been plowed?
Hint: See the Pie Chart. - Which plow was at the site of a broken mailbox complaint and when?
Hint: Click a complaint in the list to zoom the map to it. Click on the vehicle tracks in the map to see which plow recently went by there. - Where is a particular truck, and how fast is it going?
Hint: In the Header, choose a truck from the Selector dropdown.
Share It
Now, share it with colleagues or friends to show off your amazing work!
- In the upper left of the navigation panel, click Home, then Dashboard Item Details.
- Share the dashboard with a group, your organization, or the public.
- If you saved a copy of the map, you will need to share it as well. Back in the dashboard, from the Home menu you can open the webmap and share it.
You must be a registered user to add a comment. If you've already registered, sign in. Otherwise, register and sign in.