- Home
- :
- All Communities
- :
- Products
- :
- ArcGIS Dashboards
- :
- ArcGIS Dashboards Blog
- :
- ArcGIS Dashboards - Useful Links
ArcGIS Dashboards - Useful Links
- Subscribe to RSS Feed
- Mark as New
- Mark as Read
- Bookmark
- Subscribe
- Printer Friendly Page
ArcGIS Dashboards is a configurable web app that provides enables users to convey information by presenting location-based analytics using intuitive and interactive data visualizations on a single screen. Every organization using the ArcGIS platform can take advantage of ArcGIS Dashboards to help make decisions, visualize trends, monitor status in real time, and inform their communities.
Last edited: Aug 25, 2022

This blog is meant to be a live resource that will be updated to share the latest resources for working with ArcGIS Dashboards. Access the general help documentation here.
FYI: The new ArcGIS Dashboards is now out of beta: New ArcGIS Dashboards is Out of Beta
FYI 2: ArcGIS Dashboards Classic is Retiring
FYI 3: Prepare for the retirement of ArcGIS Dashboards Classic
Video Resources
- Esri Live Training Seminar on Operations Dashboard for ArcGIS - 1 hour
- UC 2018 Tech Session: Operations Dashboard for ArcGIS: An Introduction - 1 hour
- ArcGIS Dashboards - Esri Dev Summit 2021 Plenary
- ArcGIS Dashboards: Tips and Tricks (Dev Summit 2021) - 25 mins
- Arcade in ArcGIS Dashboards (Dev Summit 2021) - 1 hour
- ArcGIS Dashboards and Arcade - Esri Dev Summit 2020 Plenary
- 5 Tips to Improve your ArcGIS Dashboards - Esri Ireland video - 8 mins
- What's New in Operations Dashboard for ArcGIS (Dev Summit 2019) - YouTube - 1 hour
- Operations Dashboard for ArcGIS - Tips and Tricks (Dev Summit 2018) - YouTube - 30 mins
- Operations Dashboard for ArcGIS: Tips and Tricks (Dev Summit 2019) - YouTube - 1 hour
- Creating Dynamic, Real-Time Maps with Operations Dashboard for ArcGIS - 1 hour
- Emergency Mgmt Webinar: Achieving Situational Awareness with Ops Dashboard for ArcGIS - 1 hour
- Leveraging Dashboards: Information at the Assessor's Fingertips - 1 hour
- Intelligence Operations Webinar: Operations Dashboard for ArcGIS and Situational Awareness - 1 hour
- Operational Intelligence for Telecommunications - 1 hour
- Creating a Traffic Operations Dashboard with ArcGIS - 1 hour
- Active Investigations Dashboard - YouTube - 30 mins
- A Deeper Dive into Dashboards - Esri Ireland webinar - 1 hour
- Western University workshop: Introduction to GIS Dashboards
ArcGIS Dashboards Tutorial Videos by Esri Canada
- The New ArcGIS Dashboards in Town webinar
- Part 1: Starting an Operations Dashboard
- Part 2: Configuring an Operations Dashboard
- Part 3: Sharing an Operations Dashboard
- Operations Dashboard Tips & Tricks
- Make Your Dashboards Mobile Friendly
- From Data to Apps in 60 Minutes Or Less - Part 3 - Configuring Ops Dashboard
ArcGIS Dashboards Training Videos for COVID-19
An Esri Training Learning Plan which consists of a series of videos that helps new users learn about creating dashboards from scratch.

Blogs for New ArcGIS Dashboards
- Designing Effective Dashboards - UC 2022 Recap
- Two ways to make a grouped list for your dashboards
- Zoom in to more action support in ArcGIS Dashboards
- What's new in ArcGIS Dashboards (March 2022)
- ArcGIS Dashboards: Displaying attachments in pop-ups
- Table: The newest visualization in ArcGIS Dashboards
- Meet the new dashboard authoring experience
- What's New in Dashboards (December 2021)
- Dashboards in ArcGIS Enterprise 10.9.1
- What’s new in ArcGIS Dashboards (September 2021)
- Enhancing dashboard elements using data expressions - Part 2
- Enhancing dashboard elements using data expressions - Part 1
- What’s new in ArcGIS Dashboards (June 2021)
- Getting up to speed with redesigned selectors in ArcGIS Dashboards
- Introducing Data Expressions in ArcGIS Dashboards
- Give more context to your dashboard with selection-based display
- Pushing the limits of Arcade in dashboards
- Improve your extent-based filtering in ArcGIS Dashboards
- Displaying time spans with Arcade in dashboards
- Conditional formatting in dashboard indicators with Arcade
- Communicating status with icons using Arcade in Dashboards
How to Blogs
- Try some dashboards
- Create your first dashboard using ArcGIS Dashboards
- Configure your first dashboard
- How Did They Make That Dashboard?
- Dashboards training essentials (by Esri Canada)
- Getting started with selectors in ArcGIS Dashboards
- How to Create a Simple Real-Time Dashboard
- Adding a Splash Screen to your ArcGIS Dashboards
- Using query layers in Operations Dashboard
- Make your Dashboards more Dynamic using URL Parameters
- Percentages & More in Ops Dashboard
- Making an Auto-Focusing Real-Time Dashboard
- Monitor Your Workforce Project Using Operations Dashboard for ArcGIS
- Survey123 Tricks of the Trade: Editing records in a web form (learn how to embed a web form in a dashboard)
- How to create an information dashboard for visualizing useful data (esri Canada)
- How To: Show related records in Operations Dashboard for ArcGIS
- How To: Copy a Dashboard from one portal to another using ArcGIS API for Python
- Two dashboards, one intelligent URL
- Using ArcGIS Dashboards to monitor ArcGIS usage (ArcGIS Notebooks sample)
- How to create your own dashboard (in German) by esri Germany
- Monitor assignment status in ArcGIS Dashboards using a joined Workforce layer
- Adding a Splash Screen to your ArcGIS Dashboards
- How to make that app: Census Agriculture Dashboard
- Create a location tracking dashboard
- Add Context to your Dashboards using Data Expressions + Living Atlas
- Sharing Infographics in ArcGIS Dashboards from ArcGIS Business Analyst
- Managing ArcGIS Online Content with ArcGIS Dashboards and ArcGIS Notebooks
Best Practices Blogs
- Visualizing Data Effectively on Dashboards
- Improve your extent-based filtering in ArcGIS Dashboards
- Dashboard tips that will make you say, “I didn’t know I could do that!”
- Strategies & Best Practices for using Dashboards on your Smartphone
- Provide Context to Your Dashboard Indicators
- Pie Charts: Dos and Don’ts
- Choosing the right colors for your dashboard
- Teach an old Operations Dashboard some new tricks (Esri UK)
Resources
- 2020 Dev Summit ArcGIS Dashboards - Data Expressions sample dashboards
- Arcade samples on GitHub
- 2021 UC Designing Effective Dashboards - Samples
Esri Academy Training

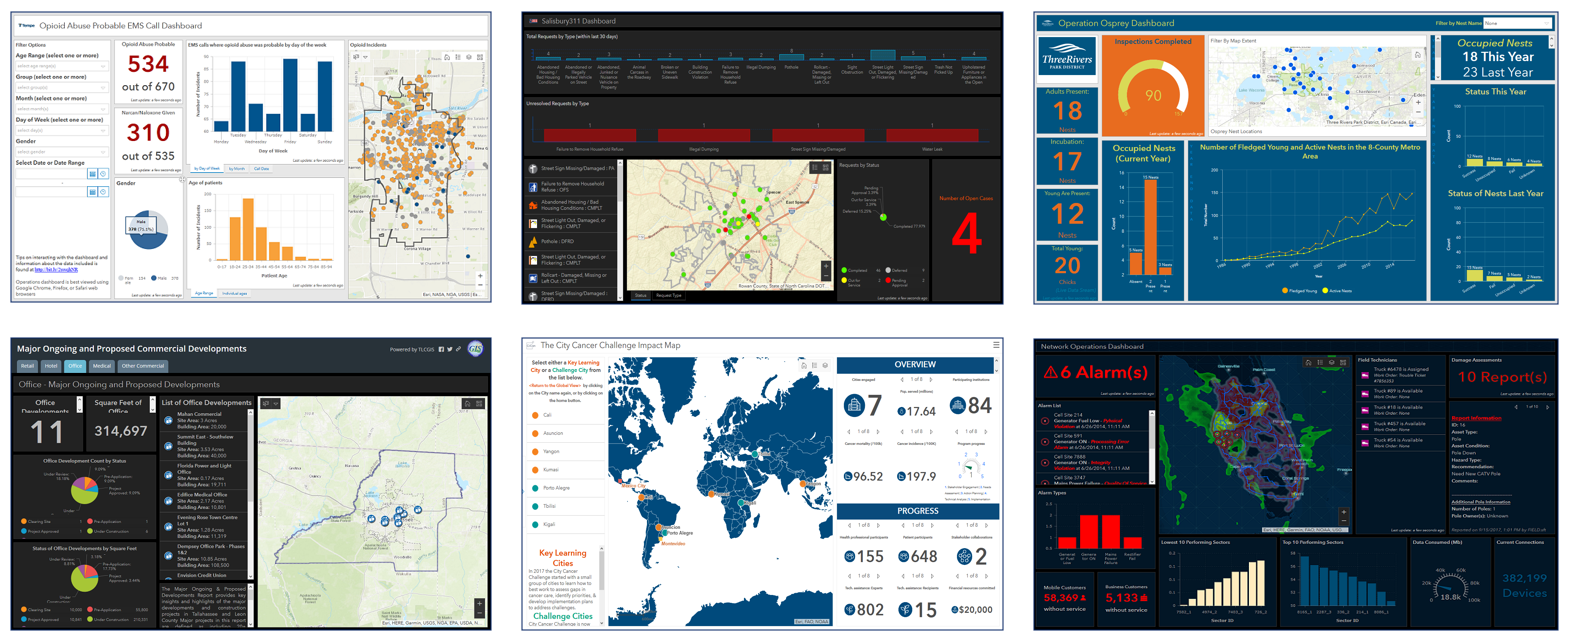
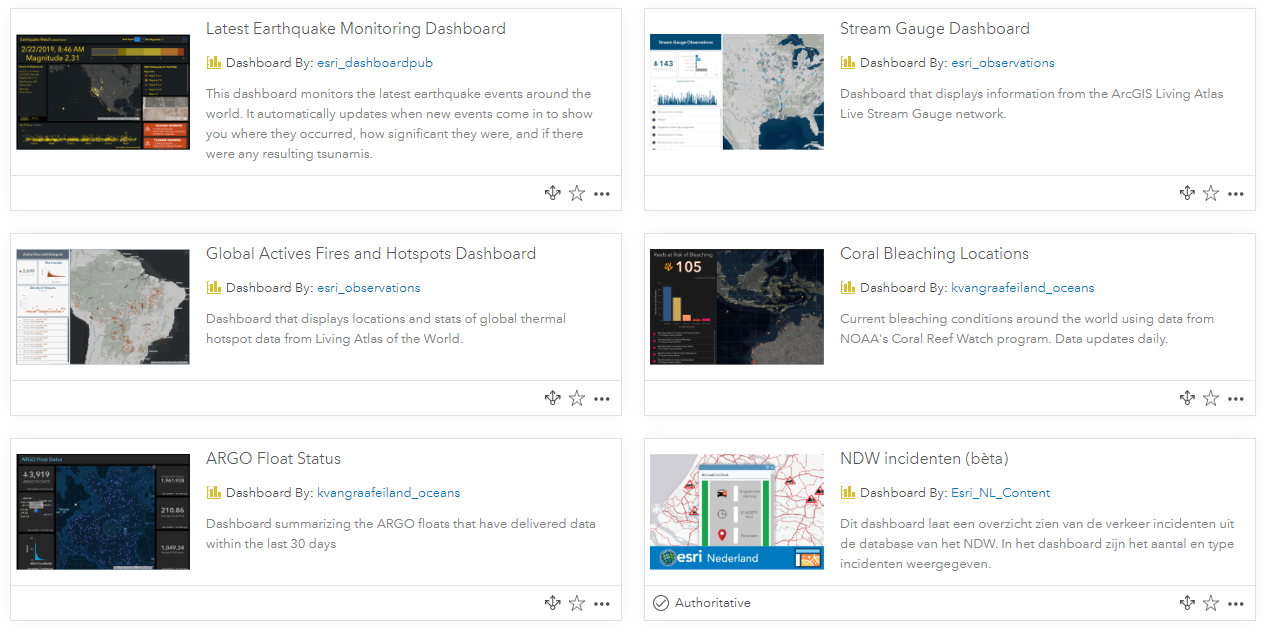
Dashboard Examples
- Government Themed Dashboards
- Health and Human Services Themed Dashboards
- Dashboards for Emergency Response
- Crime Data Dashboards
- Forestry Related Dashboards
- Transportation Themed Dashboards
- Government Elections Dashboards
- Environmental Management Dashboards
- Flood Gauge Monitoring Dashboards
- 311 Citizen Request Dashboards
- Business & Commercial Dashboards
- Real Estate Development Dashboards
- Informational Dashboards
- Social Justice Themed Dashboards
- Operations Dashboard used to help address the Opioid Epidemic
- Bird Count Volunteer Crowdsource Dashboards
- CDC Social Vulnerability Index Dashboard
- Ebola Dashboards
- City Cancer Challenge Impact Dashboard
- Iowa DOT Winter Operations Dashboard
- Social Vulnerability Dashboard by Direct Relief
- Jurassic Park Dashboard
- Operations Dashboard: 15 exemples pour vous inspirer!
ArcGIS Living Atlas - Dashboard Gallery
If you have a Dashboard to share, please email: Derek Law ([email protected]) or post on Twitter tagged with #ArcGISDashboards as we love seeing example Dashboards from users.
You must be a registered user to add a comment. If you've already registered, sign in. Otherwise, register and sign in.