- Home
- :
- All Communities
- :
- Developers
- :
- ArcGIS API for Python
- :
- ArcGIS API for Python Questions
- :
- Re: X/Y coordinates in pandas dataframe to map
- Subscribe to RSS Feed
- Mark Topic as New
- Mark Topic as Read
- Float this Topic for Current User
- Bookmark
- Subscribe
- Mute
- Printer Friendly Page
X/Y coordinates in pandas dataframe to map
- Mark as New
- Bookmark
- Subscribe
- Mute
- Subscribe to RSS Feed
- Permalink
Is there a way to add x/y coordinate columns in a pandas dataframe to a map using the arcgis python api in jupyter notebook?
- Mark as New
- Bookmark
- Subscribe
- Mute
- Subscribe to RSS Feed
- Permalink
Yes, an example is below:
locations = []
path = r'C:\xc\Presentations\GeoPython\Watson\insulators'
# find locations of broken insulators
for file in listdir(path):
    filepath = path + '\\' + file
    if is_broken(filepath):
        locations.append(get_location(filepath))

# import into ArcGIS as a layer
df = pd.DataFrame.from_records(locations)
df.columns = ['x', 'y']
broken_insulators = gis.content.import_data(df)

m.add_layer(broken_insulators)
I have defined get_locations to return longitude, latitude:
def get_location(filename): #... return lon, lat
- Mark as New
- Bookmark
- Subscribe
- Mute
- Subscribe to RSS Feed
- Permalink
Awesome! My code looks like this:
gis = GIS()
data[['Longitude_X', 'Latitude_Y']]
layer = gis.content.import_data(x)
print (layer)
map = gis.map('UK')
map.add_layer('layer')
mapdata is a pandas dataframe
<FeatureCollection>
The layer is a feature collection, but the lat long data doesn't show on the map. Possible reasons why?
- Mark as New
- Bookmark
- Subscribe
- Mute
- Subscribe to RSS Feed
- Permalink
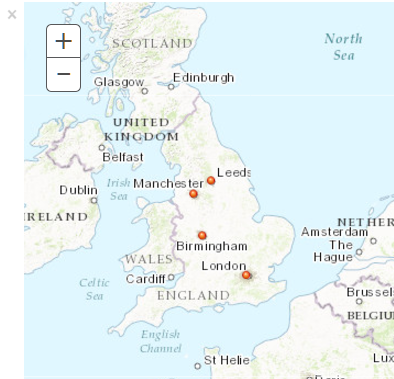
Try setting the columns of your dataframe to x and y. The following works:
from arcgis.gis import *
import pandas as pd

gis = GIS()
m = gis.map('UK')

locations = [(52.47867, -1.90848),
 (51.50642, -0.12721),
 (53.79480, -1.54653),
 (53.47959, -2.24874)]

df = pd.DataFrame.from_records(locations)
df.columns = ['y', 'x']
cities = gis.content.import_data(df)
m.add_layer(cities)
m

I get the following output:
- Mark as New
- Bookmark
- Subscribe
- Mute
- Subscribe to RSS Feed
- Permalink
Is there a way to do this with a df that has more than 1000 rows? This script throws an error for that case..
- Mark as New
- Bookmark
- Subscribe
- Mute
- Subscribe to RSS Feed
- Permalink
If it`s something that deals with memory you should give it a try with increasing the iopub_data_rate_limit; i had this kind of problem with viewing more that a few pictures.
jupyter notebook --NotebookApp.iopub_data_rate_limit=10000000000
Ionut
- Mark as New
- Bookmark
- Subscribe
- Mute
- Subscribe to RSS Feed
- Permalink
Thanks Ionut!
It still gives me the error (Error Code: 401): UnAuthorized
- Mark as New
- Bookmark
- Subscribe
- Mute
- Subscribe to RSS Feed
- Permalink
If there are more than 1000 rows, you should convert it to a SpatialDataFrame. You can do it like this:
df['SHAPE'] = df.apply(lambda row : arcgis.geometry.Geometry({'x': row['x'], 'y': row['y']}), axis=1 )
sdf = SpatialDataFrame(df)
layer = gis.content.import_data(sdf, title='My Data')
m.add_layer(layer) # add to map
find_nearest(layer, ...) # use for analysis
- Mark as New
- Bookmark
- Subscribe
- Mute
- Subscribe to RSS Feed
- Permalink
Thanks Rohit!
The exact same code snippet is giving me an error -
RuntimeError: Service name 'a' already exists for 'bkrWlSKcjUDFDtgw'I don't know how to debug it since I don't have services with that name/id..
- Mark as New
- Bookmark
- Subscribe
- Mute
- Subscribe to RSS Feed
- Permalink
There's a bug in import_data that creates a service by the name 'a' the first time it runs... the fix will be in the next update, but as a workaround you should be able to search for that service and delete it each time you're calling import_data with a spatial dataframe.