- Home
- :
- All Communities
- :
- Developers
- :
- JavaScript Maps SDK
- :
- JavaScript Maps SDK Questions
- :
- Heatmap animation ArcGIS API for JavaScript 4.10
- Subscribe to RSS Feed
- Mark Topic as New
- Mark Topic as Read
- Float this Topic for Current User
- Bookmark
- Subscribe
- Mute
- Printer Friendly Page
Heatmap animation ArcGIS API for JavaScript 4.10
- Mark as New
- Bookmark
- Subscribe
- Mute
- Subscribe to RSS Feed
- Permalink
- Report Inappropriate Content
Hello,
I use ArcGIS API for JavaScript 4.10 to visualize and animate points with a heatmap by using a single CSV file.
CSV file contains:
- Values – displayed in popup after hovering on any point
- Series number – used to identify a certain point in time in which point with heatmap are displayed
The animation is based on definitionExpression in which "series number" is replaced.
In result, animation can change the position of points and cause the change of heatmap colors (all based on values held in CSV file).
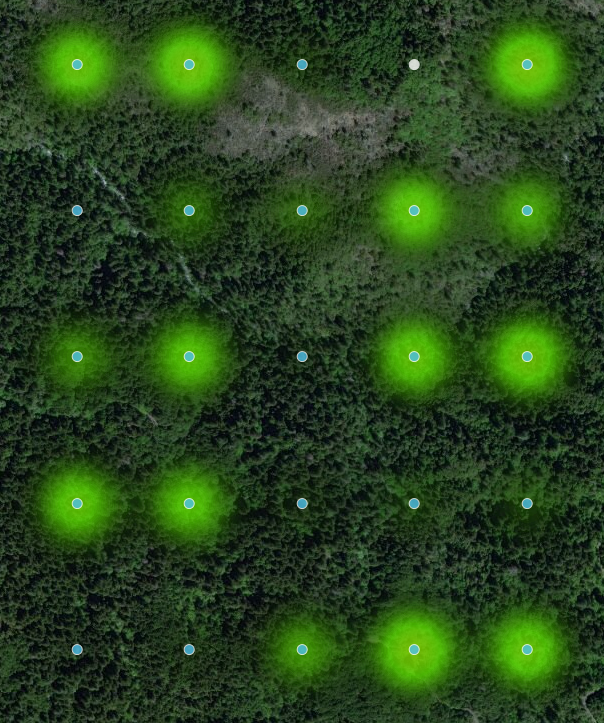
All of it works very well until animation begins to loop itself, then the heatmap “layering effect” appears. It means that after each loop of animation (going back to display the first series with its’ values) dark circles and dark background shows up even after setting colorStop { ratio: 0, color: "transparent"}.
Change of blurRadius in heatmap Renderer and change of zoom causes “layering effect” as well (dark background and dark circles are identical as in animation loop). Each zoom in and zoom out causes darkening of the heatmap layer.
Question: Is there any way of clearing view or a better method of creating the animation of the heatmap?