- Home
- :
- All Communities
- :
- Developers
- :
- JavaScript Maps SDK
- :
- JavaScript Maps SDK Questions
- :
- Re: Customize the PrintTemplate
- Subscribe to RSS Feed
- Mark Topic as New
- Mark Topic as Read
- Float this Topic for Current User
- Bookmark
- Subscribe
- Mute
- Printer Friendly Page
Customize the PrintTemplate
- Mark as New
- Bookmark
- Subscribe
- Mute
- Subscribe to RSS Feed
- Permalink
I have 2 Graphic Layers that I add to my map.
var colorOverlayLyr = new GraphicsLayer({ opacity: 0.5 });
var locationOverlayLyr = new GraphicsLayer({ opacity: 0.5 });
var map = new Map({
basemap: basemapDefault,
layers: [colorOverlayLyr, locationOverlayLyr]
});
I add graphics to the colorOverlayLyr using the QueryTask, I do this for 5 colors, only the Blue code is included but the other colors are the same. They all are added to the colorOverlayLyr.
params.where = "ID_ IN (" + blue.value + ")";
qTask.execute(params)
.then(getBlueResults)
.catch(promiseRejected);
function getBlueResults(response) {
var peakResults = arrayUtils.map(response.features, function (
feature) {
feature.symbol = {
type: "simple-fill", // autocasts as new PointSymbol3D()
color: {
r: 0,
g: 0,
b: 255,
a: 0.5
},
style: "solid",
opacity: 0.2,
outline: { color: "black", width: 1 }
};
return feature;
});
colorOverlayLyr.addMany(peakResults);
}
I add Graphics to the locationOverlayLyr. The user has the option to add up to 5 different locations on the map. This code is used passing in the different styles.
var symbolBlack = {
type: "simple-marker", // autocasts as new SimpleMarkerSymbol()
style: values[0],
color: values[1],
size: "8px",
outline: {
color: values[1]
}
};
var point = {
type: "point",
longitude: values[9],
latitude: values[8]
};
var lineAtt = {
Name: values[2],
Number: values[3],
Display: values[4]
};
var pointGraphic = new Graphic({
geometry: point,
symbol: symbolBlack,
attributes: lineAtt
});
locationOverlayLyr.add(pointGraphic);
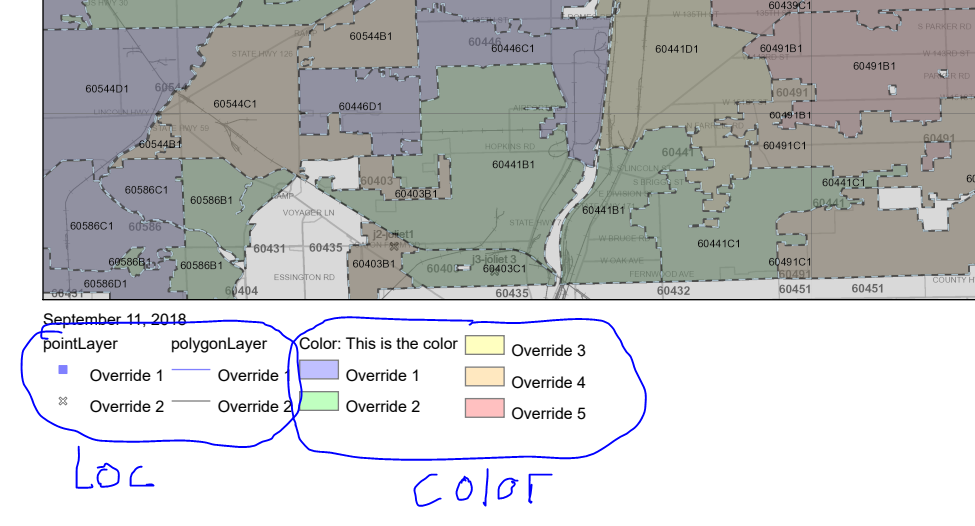
The layers come out on the map. I then use the PrintTask to allow a user to print the map. I want to customize the Legend so the user knows exactly what is on the map. I use the LegendLayer to tell what layers to show but I do know know how to customize the description that comes out for the Graphics/Features that are displayed. I can customize the title of the actual layer but the individual graphics I don't know how to. They system shows some default values. How can I change those descriptions.
var printTask = new PrintTask({
url: "https://esridev.nsamedia.com/arcgis/rest/services/Utilities/PrintingTools/GPServer/Export%20Web%20Ma..."
});
var colorlegendLayer = new LegendLayer();
colorlegendLayer.layerId = colorOverlayLyr.id;
colorlegendLayer.title = "Color: This is the color";
var locationlegendLayer = new LegendLayer();
locationlegendLayer.layerId = locationOverlayLyr.id;
locationlegendLayer.title = "Location: This is the location";
var template = new PrintTemplate({
format: "pdf",
exportOptions: {
dpi: 300
},
layout: "tabloid-ansi-b-landscape",
layoutOptions: {
titleText: "Test Map",
authorText: "Ben Loewe",
copyrightText: "My Company",
scalebarUnit: "Miles",
legendLayers: [colorlegendLayer, locationlegendLayer]
},
preserveScale: true
});
var params = new PrintParameters({
view: view,
template: template
});
printTask.execute(params).then(printResult, promiseRejected);
- Mark as New
- Bookmark
- Subscribe
- Mute
- Subscribe to RSS Feed
- Permalink
David,
Are you applying a UniqueValueRenderer to those layers?
  var renderer = new UniqueValueRenderer( ... );
  renderer.addValue("KS", symbol);

  //Specify the symbol and value using the info object.
  renderer.addValue({
    value: "KS",
    symbol: new SimpleFillSymbol(),
    label: "Kansas",
    description: "The Sunflower State"
  });
That way you can specify the label and description for the feature
- Mark as New
- Bookmark
- Subscribe
- Mute
- Subscribe to RSS Feed
- Permalink
Looking at the documentation for the UniqueValueRenderer, that object can only be used on certain Layer Types. Graphic Layers are not one of the layer types in the list to use.
- Mark as New
- Bookmark
- Subscribe
- Mute
- Subscribe to RSS Feed
- Permalink
Absolutely it can.
- Mark as New
- Bookmark
- Subscribe
- Mute
- Subscribe to RSS Feed
- Permalink
In my example above where I am getting a list of geographies to show in a blue color based on a demographic they chose, I get the results back from the QueryTask and loop through the array of results assigning a simple-fill symbol to it. Is it at this point that I apply a renderer to the feature? I am not quite sure of when to apply the renderer. The value, label, and description will change everytime this QueryTask is ran. Especially for the other 4 QueryTasks that I run to also fill this colorOverlayLyr.
- Mark as New
- Bookmark
- Subscribe
- Mute
- Subscribe to RSS Feed
- Permalink
David,
So after the values have changed (post query) you can reset the layer renderer to the new values added to the UniqueValueRenderer.
- Mark as New
- Bookmark
- Subscribe
- Mute
- Subscribe to RSS Feed
- Permalink
I tried the following additions:
var blueColoreOverlay = {
type: "simple-fill",
color: {
r: 0,
g: 0,
b: 255,
a: 0.5
},
style: "solid",
opacity: 0.2,
outline: { color: "black", width: 1 }
};
var colorRenderer = {
type: "unique-value",
uniqueValueInfos: [{
symbol: blueColoreOverlay,
label: "Residential"
}]
};
// Create graphics layer and symbol to use for displaying the results of query
var highlightGeographyLyr = new GraphicsLayer({ renderer: colorRenderer, id: 1, opacity: 0.1 });
Then I used the blueColoreOverlay in the QueryTask:
function getBlueResults(response) {
var peakResults = arrayUtils.map(response.features, function (
feature) {
feature.symbol = blueColoreOverlay;
return feature;
});
colorOverlayLyr.addMany(peakResults);
}
It seems as my overlays are still coming up correctly. When I try to print I am getting the following error:
a.renderer.toJSON is not a function
- Mark as New
- Bookmark
- Subscribe
- Mute
- Subscribe to RSS Feed
- Permalink
David,
I missed the fact that you are using 4.x API. I don't think my UniqueValueRendere suggestion will work in your case using 4.x.
- Mark as New
- Bookmark
- Subscribe
- Mute
- Subscribe to RSS Feed
- Permalink
Is there any other way to manipulate the PrintTemplate to show customized text?
- Mark as New
- Bookmark
- Subscribe
- Mute
- Subscribe to RSS Feed
- Permalink
Only if you are using your own print service on your ArcGIS Server.