- Home
- :
- All Communities
- :
- ArcGIS Topics
- :
- Applications Prototype Lab
- :
- Applications Prototype Lab Blog
- :
- Indoor Location Prototype
Indoor Location Prototype
- Subscribe to RSS Feed
- Mark as New
- Mark as Read
- Bookmark
- Subscribe
- Printer Friendly Page
Introduction
The most common technique for indoor location, determining an observer location inside an enclosed space, is the blue dot tracking approach. A client-side algorithm is actively tracking signals in its environment to determine the observer’s location in the context of the received signals. The types of received electronic signals can range from 802.11.x signals (WiFi, Bluetooth, etc.) to detecting magnetic anomalies. This method is considered an active client-side location approach.
A different method is to perform the positioning server side. The environment itself is configured to seek out surrounding signals and to correlate the matching signals from various points within the environment. This is a called a passive server-side approach.
We (the Applications Prototype Lab) wanted to explore the passive approach a little further as it allows for greater flexibility in the types of devices that can be recorded. Since no additional software needs to be installed on a device of interest, we can detect new hardware in our in-situ environment. However, since we must receive multiple recordings from our environment, a proper hardware layout is required to guarantee an adequate amount of coverage.
We do see potential for the server-based location services in the context of determining the digital footprint and traffic flow within a given location. For a business, this approach could be helpful for planning and design efforts as well as to provide on-demand information in contingency situations.
Prototype Layout
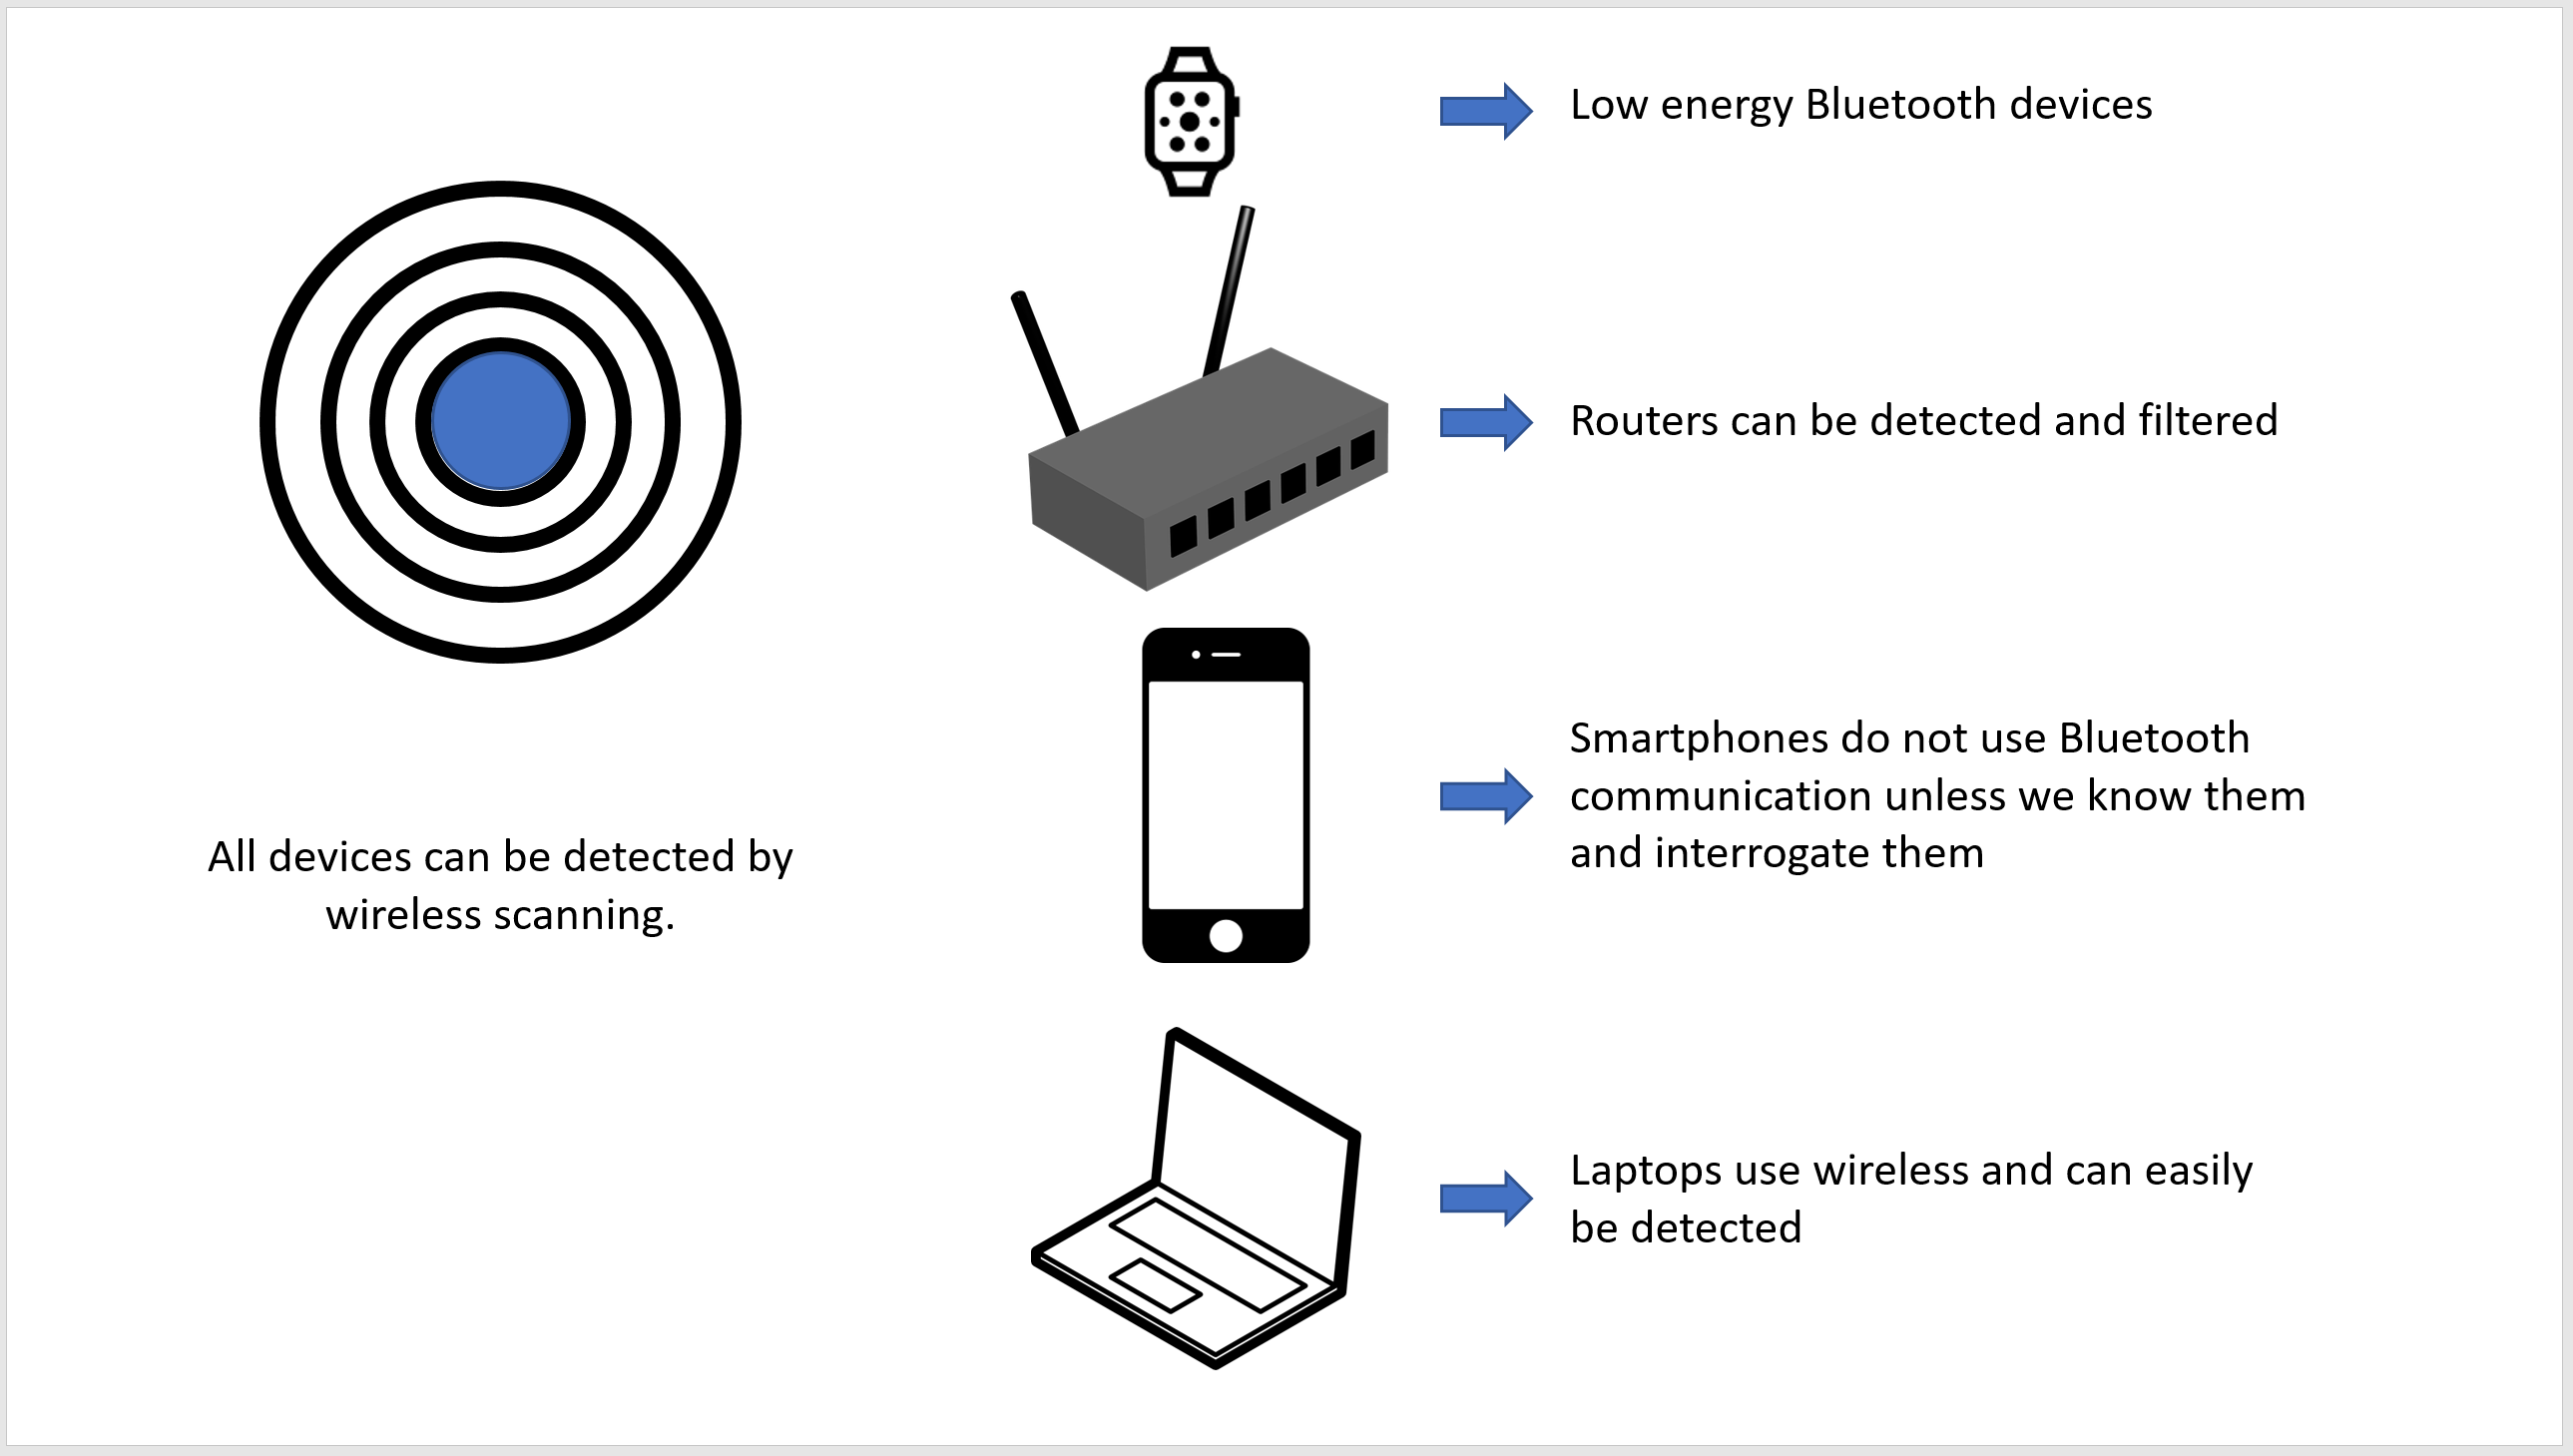
Here is the general strategy we implemented. The blue dot in the diagram represents a scanning device (blue box) actively seeking out signals. For this prototype we focused on detecting smart watches, wireless routers, cell phones, and laptops.
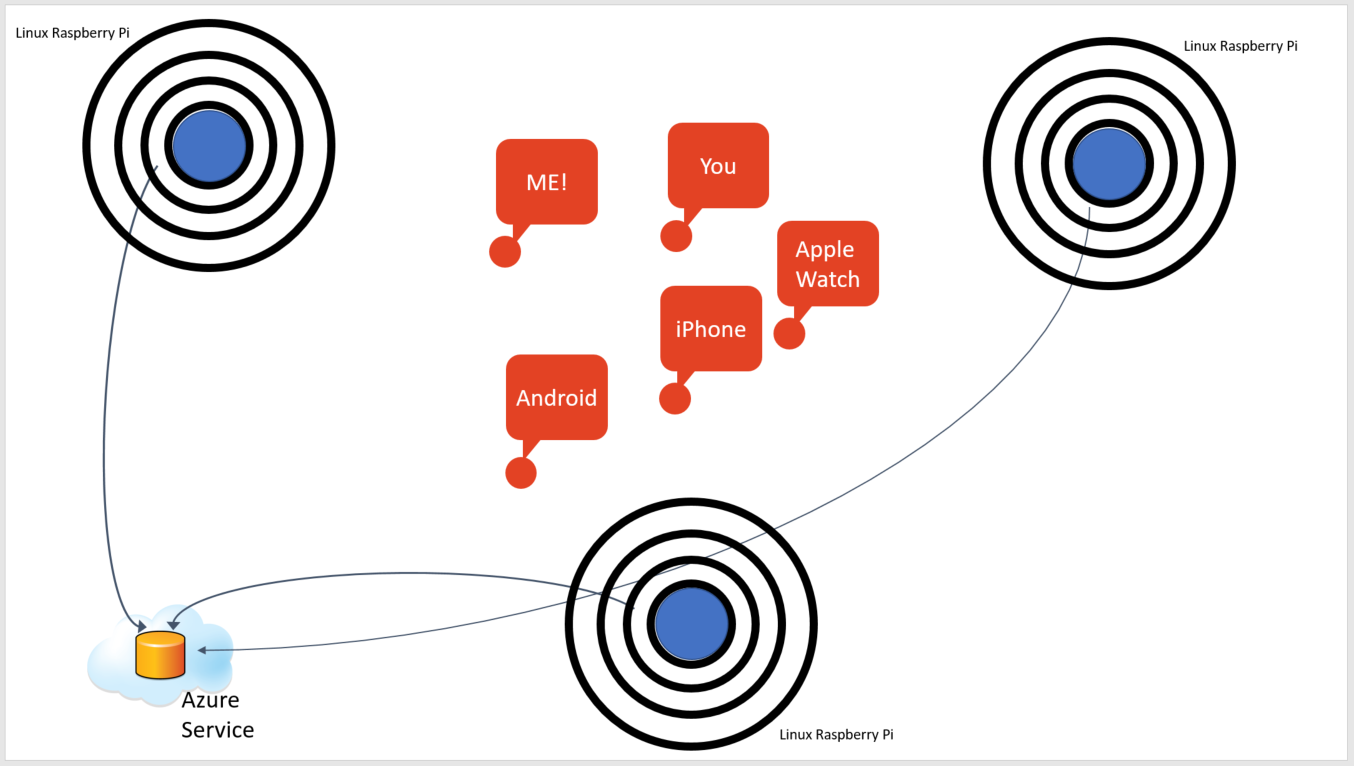
Using multiple blue boxes, we built out an environment keeping track of the signals in our office area. The blue boxes submit signals that are recorded by a central service in the cloud. In addition to providing a central collection service, the cloud service keeps us informed about the current state of the blue box hardware and provides a software update mechanism.
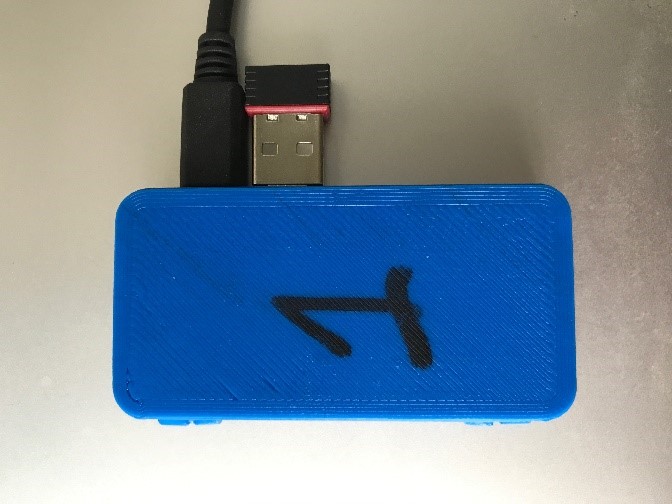
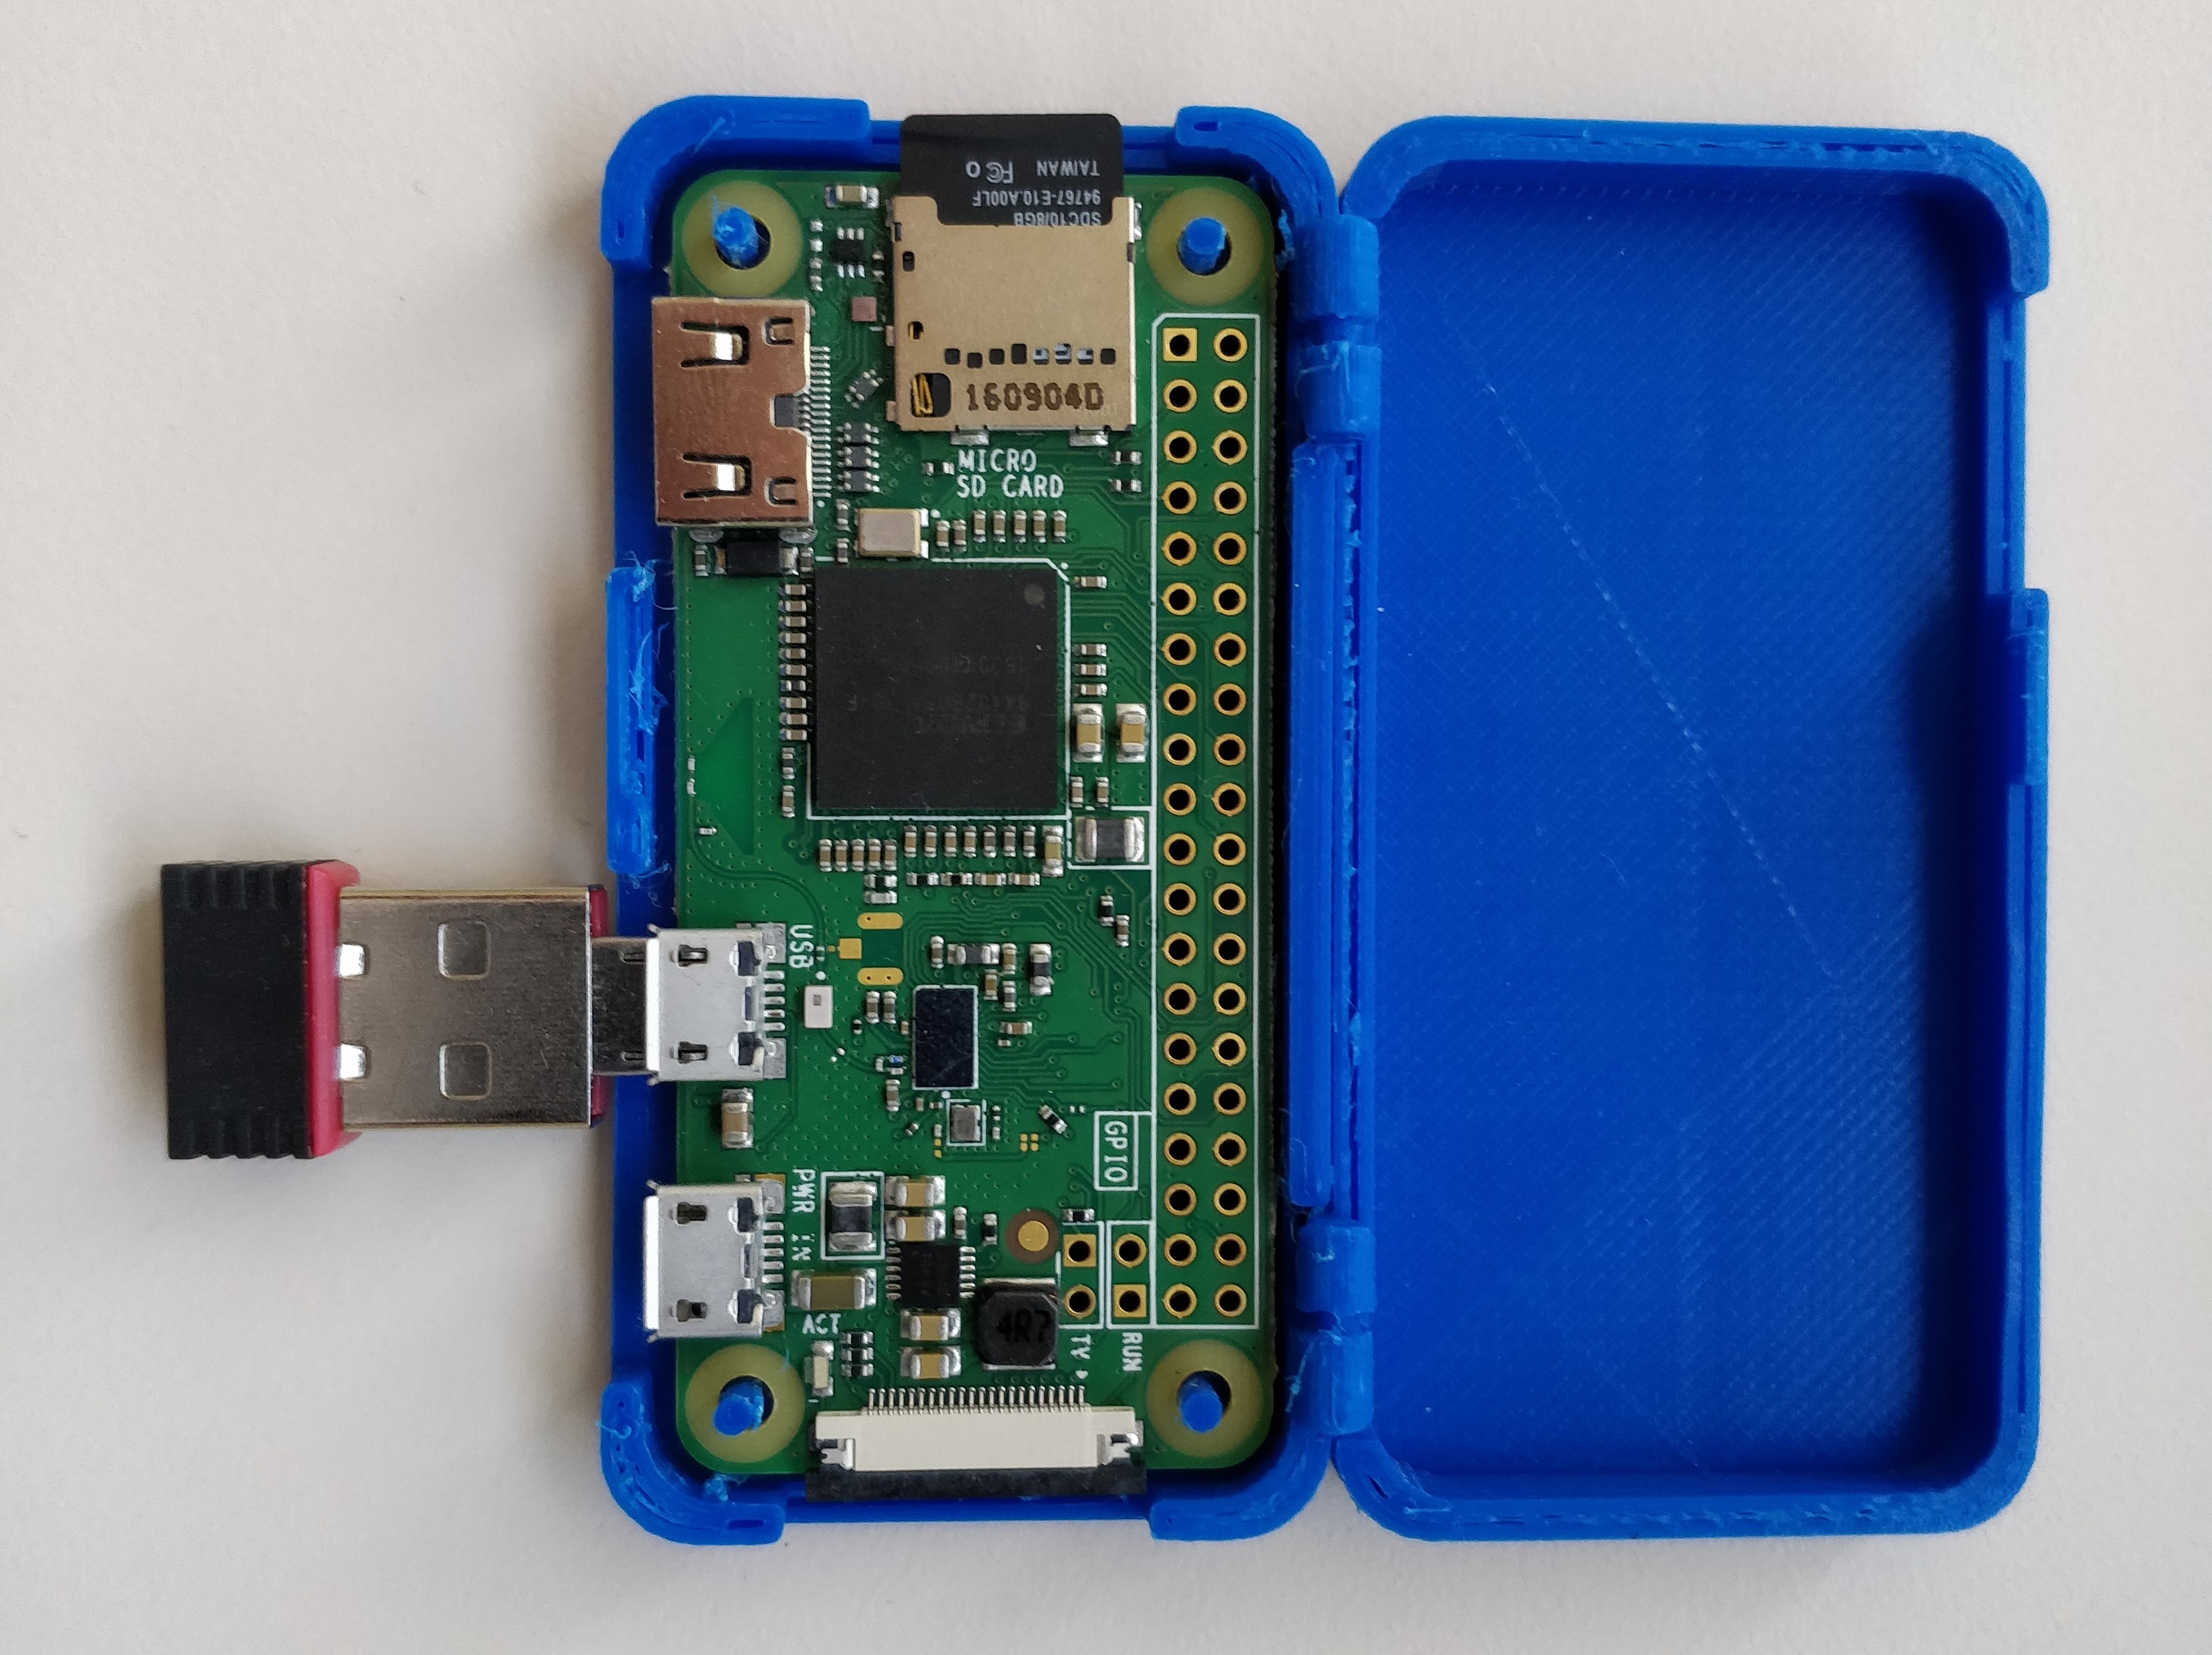
Hardware
In building our blue box prototype, we used a Raspberry Pi Zero W board running Raspian Jessie 4.9.24. The Zero hardware is nice as it already has a Bluetooth and WiFi chip onboard. Since we are using the onboard chip for communication with the cloud service, we need one more wireless adapter ( seen as the dongle) to act as the scanner module.
For simplicity, we distributed the blue boxes around our office area and kept them connected to a power outlet to get a continuous 24 hours data collection.
To give the blue boxes a spatial identity, we wrote an ArcGIS Runtime based application that allows us to place the blue box in the context of the building.
Methodology
When the Raspberry Pi starts up, it registers itself with the central cloud service. Upon registration, the blue box is assigned a unique identifier based on the MAC address, and client-side scripts ensure that the existing software is in sync with the version provided by the cloud environment.
After the initial handshake, the blue box assumes its scanning role and is ready to receive WiFi MAC addresses and record the RSSI (received signal strength indicator) for Bluetooth and WiFi devices. This information is sent to the cloud service from where we can use a trilateration algorithm to position the recorded signals. The location information is stored as a time-enabled point feature in ArcGIS Online.
Results
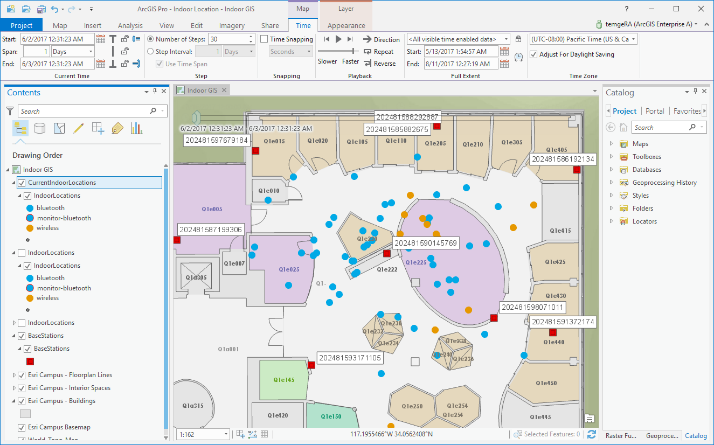
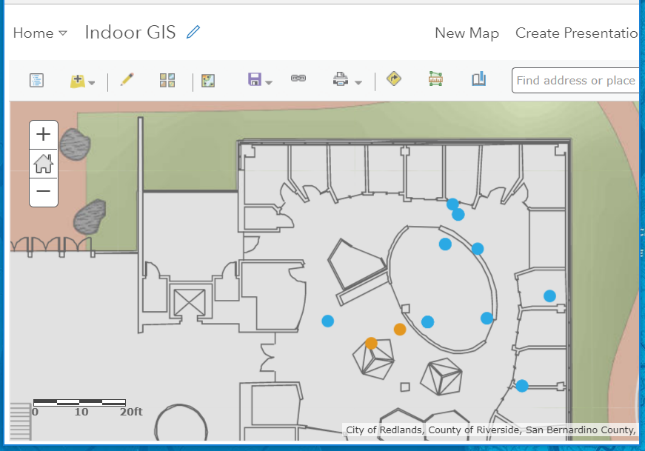
The screen capture below shows the distribution and the location of received signals. The blue dots are recorded Bluetooth signals and the amber colored dots are WiFi signals. The red squares show the location of the blue boxes in the context of the building with their associated unique identifier. Using the time awareness of the feature service, we can show the live data as a layer in ArcGIS Pro or in a web map.
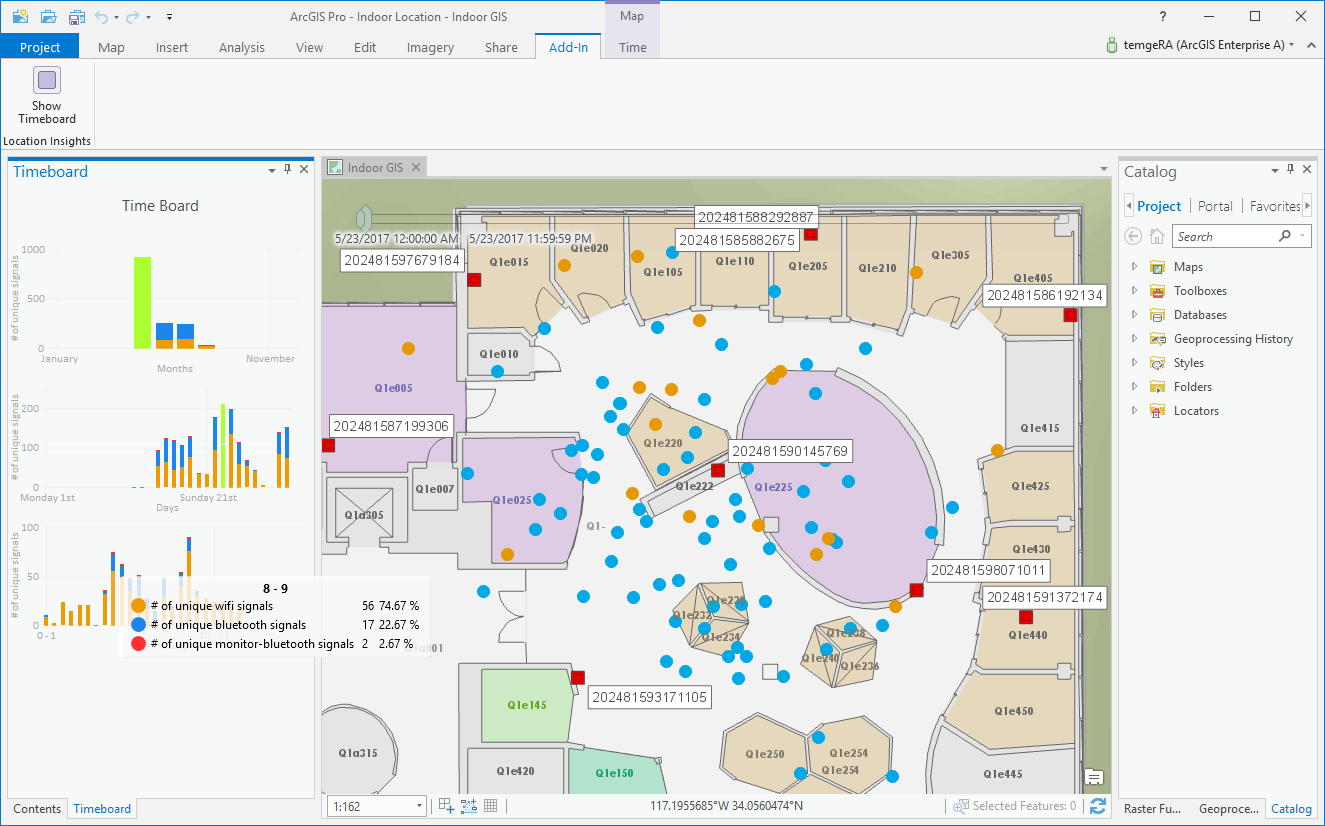
We also developed an ArcGIS Pro Addin to view the archived content distribution by date and device type. We can see the start and the end of a work day as the numbers of devices increase throughout the day. Another interesting observation is the drop-off of Bluetooth devices during the nights and the weekends.
Conclusion
We prototyped a server-based location service and we integrated our solution into ArcGIS Enterprise. For our blue box prototype, we used a low-cost hardware approach that has the potential to scale beyond our testing environment. We have written helper applications for the ArcGIS Runtime (iOS) and the ArcGIS Pro application to facilitate the setup and analysis of the recorded information. With the described approach, we see the potential for ubiquitous presence detection offering an indoor accuracy of about 8 – 20m / 24 – 60 ft.
You must be a registered user to add a comment. If you've already registered, sign in. Otherwise, register and sign in.