3D Blog - Page 2

cancel
Showing results for 
Show  only  | Search instead for 
Did you mean: 

Latest Activity

(40 Posts)
by Anonymous User
Not applicable

Most people working with 3D modeling software are not aware of how heavy textures can impact performance in the modeling process and the end-user experience.

When generating textures I always recommend creating them at a higher resolution than the final product. The reasoning is that you can always down-sample the image (Reduce number of pixels) later on but you can never scale the image back up.

For procedural modeling in Esri CityEngine and generating your libraries optimizing texture and model asset size as much as possible is key for ensuring fast performance and the ability to model massive environments.

The following script takes the difficulty out of manually scaling the images in your pipeline enabling complete automation allowing you to continue focusing on the design aspect of your project you know and love...

# -------------------------------------------------------------------------------
# Name:        ImageAutoResize.py
# Purpose:     Script for batch optimizing image for optimal performance in 3D software
#
# Author:      Geoff Taylor
#
# Created:     11/19/2018
# Copyright:   (c) Esri 2018
# updated:

# Required:
# License: Apache

# -------------------------------------------------------------------------------

import os, sys
from math import ceil
from PIL import Image, ImageStat


inFolder = r'inputFolderPathGoesHere!'
outFolder = r'outputFolderPathGoesHere!'

''' Max Width and height are only relative for a single side of the image. 
if one side of the image is larger then the smaller side will be scaled to the minimum value 
and larger scaled fractionally to the smaller side'''

minWidth = 300
minHeight = 300

fileFormats = ['.jpg'# Currently only Supports .jpg

###############
# Definitions #
###############


def update_progress(progress):
    barLength = 10  # Modify this to change the length of the progress bar
    status = ""
    if isinstance(progress, int):
        progress = float(progress)
    if not isinstance(progress, float):
        progress = 0
        status = "error: progress var must be float\r\n"
    if progress < 0:
        progress = 0
        status = "Halt...\r\n"
    if progress >= 1:
        progress = 1
        status = "Done...\r\n"
    block = int(round(barLength*progress))
    text = "\rPercent Complete: [{0}] {1}% {2}".format("#"*block + "-"*(barLength-block), progress*100, status)
    sys.stdout.write(text)
    sys.stdout.flush()


def fileExt(inFile):
    ''' [0] returns fileName, [1] returns Extension '''
    filename, file_extension = os.path.splitext(inFile)
    return filename, file_extension.lower()


def genDirectory(inPath):
    if not os.path.exists(inPath):
        os.makedirs(inPath)


def delIfFileExists(inFile,outFolder):
    fullFilePath = os.path.join(outFolder, inFile)
    if os.path.exists(fullFilePath):
        try:
            os.remove(fullFilePath)
        except:
            print("Could not remove {0}".format(fullFilePath))
    else:
        pass


def imageColorType(pilImg):
    thumb_size = 40
    MSE_cutoff = 22
    adjust_color_bias = True
    bands = pilImg.getbands()
    if bands == ('R', 'G', 'B') or bands == ('R', 'G', 'B', 'A'):
        thumb = pilImg.resize((thumb_size, thumb_size))
        SSE, bias = 0, [0, 0, 0]
        if adjust_color_bias:
            bias = ImageStat.Stat(thumb).mean[:3]
            bias = [b - sum(bias)/3 for b in bias]
        for pixel in thumb.getdata():
            mu = sum(pixel)/3
            SSE += sum((pixel - mu - bias)*(pixel - mu - bias) for i in [0, 1, 2])
        MSE = float(SSE)/(thumb_size*thumb_size)
        if MSE <= MSE_cutoff:
            return "grayscale"
        else:
            return "color"
    elif len(bands) == 1:
        return "bw"
    else:
        return "unknown"


def imageFitsDimensions(inPilImg, minWidth, minHeight):
    width, height = inPilImg.size
    if width <= minWidth or height < minHeight:
        return True
    else:
        return False


def imageScaling(inPilImg, minWidth, minHeight):
    width, height = inPilImg.size
    if height > width:
        scaleFactor = minWidth / width
        return minWidth, ceil(scaleFactor*height)
    elif width > height:
        scaleFactor = minHeight / height
        return ceil(scaleFactor*width), minHeight
    else:
        return minWidth, minHeight


################
# Begin Script #
################

genDirectory(outFolder)

imageFiles = [f for f in os.listdir(inFolder) if
              os.path.isfile(os.path.join(inFolder, f)) and fileExt(f)[1] in fileFormats]

count = 0
for imageFile in imageFiles:
    if count > 0:
        update_progress(count/len(imageFiles))
    delIfFileExists(imageFile, outFolder)
    inFile = os.path.join(inFolder, imageFile)
    outFile = os.path.join(outFolder, imageFile)
    count += 1
    try:
        im = Image.open(inFile)
        if imageColorType(im) != "color":
            im.convert('RGB')
        if imageFitsDimensions(im, minWidth, minHeight):
            im.save(outFile, "JPEG")
        else:
            imageScaling(im, minWidth, minHeight)
            im.save(outFile, "JPEG")
            outImg = im.resize((imageScaling(im, minWidth, minHeight)[0], imageScaling(im, minWidth, minHeight)[1]),
                               Image.ANTIALIAS)
            # outImg.save(outFile, quality=95)
            outImg.save(outFile, optimize=True, quality=95)
    except IOError:
        print("cannot resample image for" % imageFile)
update_progress(100)

Just install the Python Imaging Library fork "Pillow" https://python-pillow.org/ and run the script on the folder containing your textures.

more
1 3 1,119
by Anonymous User
Not applicable

I am pleased to announce the initial release the 3D Street Sign Library compatible with Esri Collector for ArcGIS. Enabling City, County, and State agencies to easily begin visualizing their data as a Digital Twin.


Collector for ArcGIS enables anyone to use their smartphone or tablet to collect and update information in the field, whether connected or disconnected on Android, iOS, or Windows devices.

The Esri Sign Inventory Solution enables public works field staff to inventory traffic signs erected at the side of, or above roads in collector. The Sign Inventory map helps public works staff develop a comprehensive inventory of signs and the poles to which they are attached to and prepares this information for related maintenance management workflows.

Once street signs have been collected just it's only a few simple steps to 3D visualization with the 3D Signs Library.

You can download the 3D Street Signs library here https://esri.box.com/v/StreetSignsUS3D

**The current release only supports Signs. Poles to be released soon**


We are beginning to incorporate the 3D Street Sign inventory functionality into the Complete Streets rules in collaboration with David Wasserman: https://github.com/d-wasserman/Complete_Street_Rule

more
2 2 2,288
by Anonymous User
Not applicable

These steps show how to convert 2-dimensional (2D) points into 3-dimensional (3D) ones, and how to use those points to convert 2D lines into 3D lines, given the existence of an elevation (Z) attribute within the point layer. The points and lines should have a meaningful, connective, spatial relationship. Examples include sewer manholes and sewer lines; water valves, hydrants, and water lines; street lights and underground power feed lines.

Prerequisites:

  • ArcGIS Desktop Advanced (formerly called ArcInfo)
  • 3D Analyst Extension for Desktop (extension files must be installed and then checked out in Customize > Extensions…)

For best results:

  • Single-part, 2D lines are best.  Multi-part, 2D lines can be converted to 3D, but the results need to be re-broken into parts
  • If the point layer is actually a multipoint layer, use ArcToolbox > Data Management Tools > Features > Multipart to Singlepart first, and use the resulting layer in the instructions below
  • It is desirable that the point and line feature classes share the same coordinate system, resolution, and tolerance to improve the Spatial Join step
  • These steps assume that an elevation of 0 is valid, such as sea level. If this is not the case, you should change the SQL queries below or set 0's to NULL through Field Calculator.

Notes:

  • These steps do not alter the original data
  • It is not necessary that all line vertices coincide with all points
  • It is not necessary that all points coincide with line vertices
  • It is not necessary that all of the points have a non-null, non-zero value for elevation

Tools and dialogs require input and output values. Values colored in orange reference the tutorial data. In practice, choose your own feature classes, field names, and constants. Values colored in blue are output values; you choose the name of what is created.   Blue feature classes are not included in the .zip file.   I try to use ArcToolbox throughout, so that the Geoprocessing Results window contains all steps as they were taken.   Tools that modify or create new data work off of the selected features, if any, or all features if there is no selection, so keep that in mind.

These steps were tested with ArcGIS Desktop 10.6.1, but may work in other versions as well. A downloadable .zip file contains a 10.6.1 map document with fake data in a file geodatabase to work through as a tutorial. In 10.6.1, I noticed that wizards worked all of the time, while ArcToolbox only worked most of the time. When the ArcMap UI offers a way of doing something that a Toolbox also provides, use the UI in 10.6.1.

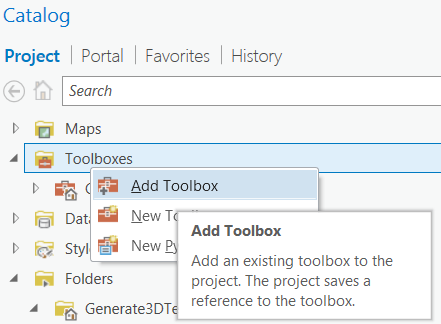
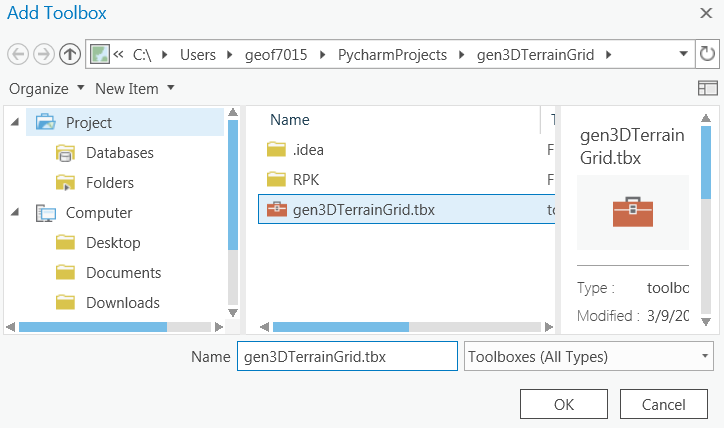
First, create a map document containing the layers you are interested in converting, as well as a few layers for reference. Save at every meaningful point along the way.

Second, create 3D points from 2D points. This tool can be run with any level of Desktop, but requires 3D Analyst.

  • ArcToolbox > 3D Analyst Tools > Feature to 3D By Attribute
    • Input Features: MY_2D_POINTS
    • Output Feature Class: MY_3D_POINTS
    • Height Field: Z
    • To Height Field: None
    • OK

Examine the output attribute table. The SHAPE field should show "Point Z". The properties of your feature class should show "Coordinates include Z values. Used to store 3D data" as checked. All of the fields from the original 2D feature class should be intact, including names, types, aliases, widths, and domains.

Third, create a new 2D point layer whose geometry and attributes represent the vertices of the 2D lines. For example, a line with four vertices in your 2D layer will result in four point features in your output layer. Each feature will have the attributes of the line it came from.   This tool can only be run with an Advanced Desktop license, but does not require 3D Analyst.

  • ArcToolbox > Data Management Tools > Features > Feature Vertices to Points
    • Input Features: MY_2D_LINES
    • Output Feature Class: MY_2D_VERTICES
    • Point Type: ALL
    • OK

Examine the output attribute table. There will be more features in this feature class than the original, because each feature is a point representing the vertex of the original geometry. An important field in the output is ORIG_FID. This corresponds to the OBJECTID in the original 2D layer.

Fourth, find out which vertices correspond to the 3D points.   You might have 3D points match 0, 1, or more 2D vertices, and you might have 2D vertices which match 0, 1, or more 3D points. If a line's vertex matches up with more than one feature with different elevations, choose how ArcToolbox will resolve the elevation in the step marked with a * below.

  • ArcToolbox > Analysis Tools > Overlay > Spatial Join
    • Target Features: MY_2D_VERTICES
    • Join Features: MY_3D_POINTS
    • Output Feature Class: MY_2D_VERTEX _POINTS
    • Join Operation: JOIN_ONE_TO_ONE
    • Keep All Target Features: Checked
    • * Field Map of Join Features: Right-click Z > Properties… and select Mean for Merge Rule
    • Match Option: WITHIN_A_DISTANCE (or INTERSECT or ARE_IDENTICAL_TO, if your original 2D line or polygon feature vertices are all snapped to the original 2D points)
    • Search Radius (optional): Your choice. I chose 1
    • Units: Your choice.   I chose Inches
    • OK

Examine the output attribute table. Although the SHAPE is a "Point Z", the actual Z values in the feature geometry are 0.   Next, find which vertices will not have a proper elevation.

  • ArcToolbox > Data Management Tools > Layers and Table Views > Select Layer By Attribute
    • Layer Name or Table View: MY_2D_VERTEX_POINTS
    • Selection type: NEW_SELECTION
    • Expression: Join_Count = 0 OR Z IS NULL
    • OK

Examine the input attribute table. The selected features represent vertices from your 2D lines that didn't coincide with any 3D points OR coincided with points of unknown altitude. You'll notice that the elevation field for these points is <Null> which means "Unknown".

Fifth, you must make a decision as to how the original shapes will be transformed to 3D when the elevations of these vertices are missing.   Here are viable options I present to you:

Option A: Assume a flat, constant elevation value where the elevation is unknown. Edges of your resulting 3D lines will dip or rise to this constant elevation. This will help you find anomalies if you choose a very low or very high value. However, it will make your data look weird in 3D. If your data is relatively flat, this could be a good option. If you go this route, proceed to "Steps for Option A".

Option B: Assign a Z value per vertex that is the average of the other Z values in the same line. Edges of your resulting 3D lines will dip or rise moderately. However, this will give a false picture of your data in 3D space while not drawing attention to the anomalies. If you go this route, proceed to "Steps for Option B".

Option C: Do nothing and allow 3D vertices to have a 0 or NULL value. You might also choose this option if all of your vertices coincided with points of known elevation. If you go this route, proceed to "Continue".

Steps for Option A

Select all the vertices where the elevation is unknown and calculate a fixed value for those.

  • ArcToolbox > Data Management Tools > Layers and Table Views > Select Layer By Attribute
    • Layer Name or Table View: MY_2D_VERTEX_POINTS
    • Selection type: NEW_SELECTION
    • Expression: Join_Count = 0 OR Z IS NULL
    • OK
  • ArcToolbox > Data Management Tools > Fields > Calculate Field
    • Input Table: MY_2D_VERTEX_POINTS
    • Field Name: Z
    • Expression: 4300 (or the flat Z value you picked)
    • OK
  • Proceed to "Continue"

Steps for Option B

Find all the vertices where the elevation is known, and calculate an average elevation per feature.

  • ArcToolbox > Data Management Tools > Layers and Table Views > Select Layer By Attribute
    • Layer Name or Table View: MY_2D_VERTEX_POINTS
    • Selection type: NEW_SELECTION
    • Expression: Join_Count > 0 AND Z IS NOT NULL
    • OK
  • ArcToolbox > Analysis Tools > Statistics > Summary Statistics
    • Input Table: MY_2D_VERTEX_POINTS
    • Output Table: MY_AVG_LINE_Z
    • Statistics Fields: Z (MEAN)
    • Case field: ORIG_FID
    • OK
  • ArcToolbox > Data Management Tools > Layers and Table Views > Select Layer By Attribute
    • Input Table: MY_2D_VERTEX_POINTS
    • Selection type: CLEAR_SELECTION
    • OK

Join the results of the average elevation table to the vertices table by feature ID. Copy the elevation attribute over to the vertices where the vertex elevation is unknown. But before the join is performed, index important fields.

  • ArcToolbox > Data Management Tools > Indexes > Add Attribute Index
    • Input Table: MY_2D_VERTEX_POINTS
    • Fields to Index: ORIG_FID
    • Index Name: I_ORIG_FID
    • Unique: Unchecked
    • Ascending: Checked
    • OK
  • ArcToolbox > Data Management Tools > Indexes > Add Attribute Index
    • Input Table: MY_AVG_LINE_Z
    • Fields to Index: ORIG_FID
    • Index Name: I_ORIG_FID
    • Unique: Unchecked
    • Ascending: Checked
    • OK
  • ArcToolbox > Data Management Tools > Joins > Add Join
    • Layer Name or Table View: MY_2D_VERTEX_POINTS
    • Input Join Field: ORIG_FID
    • Join Table: MY_AVG_LINE_Z
    • Output Join Field: ORIG_FID
    • Keep All Target Features: Checked
    • OK
  • ArcToolbox > Data Management Tools > Layers and Table Views > Select Layer By Attribute
    • Layer Name or Table View: MY_2D_VERTEX_POINTS
    • Selection type: NEW_SELECTION
    • Expression: MY_2D_VERTEX_POINTS.Z IS NULL AND MY_AVG_LINE_Z.MEAN_Z IS NOT NULL
    • OK
  • ArcToolbox > Data Management Tools > Fields > Calculate Field
    • Input Table: MY_2D_VERTEX_POINTS
    • Field Name: Z
    • Expression: [MY_AVG_LINE_Z.MEAN_Z]
    • Expression Type: VB
    • OK
  • Remove the join (or ArcToolbox > Data Management Tools > Joins > Remove Join)
  • Proceed to "Continue" just below

Continue

  • Clear the Selection (or ArcToolbox > Data Management Tools > Layers and Table Views > Select Layer By Attribute > Selection type: CLEAR_SELECTION).

Sixth, now that the line vertices know their elevations, they can be converted to 3D points, and then stitched together into 3D lines with attributes from the original 2D lines.

  • ArcToolbox > 3D Analyst Tools > 3D Features > Feature to 3D By Attribute
    • Input Features: MY_2D_VERTEX_POINTS
    • Output Feature Class: MY_3D_VERTICES
    • Height Field: Z
    • OK
  • ArcToolbox > Data Management Tools > Features > Points to Line
    • Input Features: MY_3D_VERTICES
    • Output Feature Class: MY_3D_LINES
    • Line Field: ORIG_FID
    • Sort Field: OBJECTID
    • Close Line: Unchecked
    • OK
  • ArcToolbox > Data Management Tools > Joins > Join Field
    • Input Table: MY_3D_LINES
    • Input Join Field: ORIG_FID
    • Join Table: MY_2D_LINES
    • Output Join Field: OBJECTID
    • Join Fields: (All except OBJECTID AND Shape_Length)
    • OK
  • ArcToolbox > Data Management Tools > Fields > Delete Field
    • Input Table: MY_3D_LINES
    • Drop Field: ORIG_FID
    • OK

Now, you can delete intermediate data if you so desire. You do so at your own risk. The temporary feature classes and tables are MY_2D_VERTICES, MY_2D_VERTEX_POINTS, MY_AVG_LINE_Z, and MY_3D_VERTICES. In the future, you might be able to delete your 2D feature classes when you and your organization have migrated to using the 3D data in all applications, maps, and services.

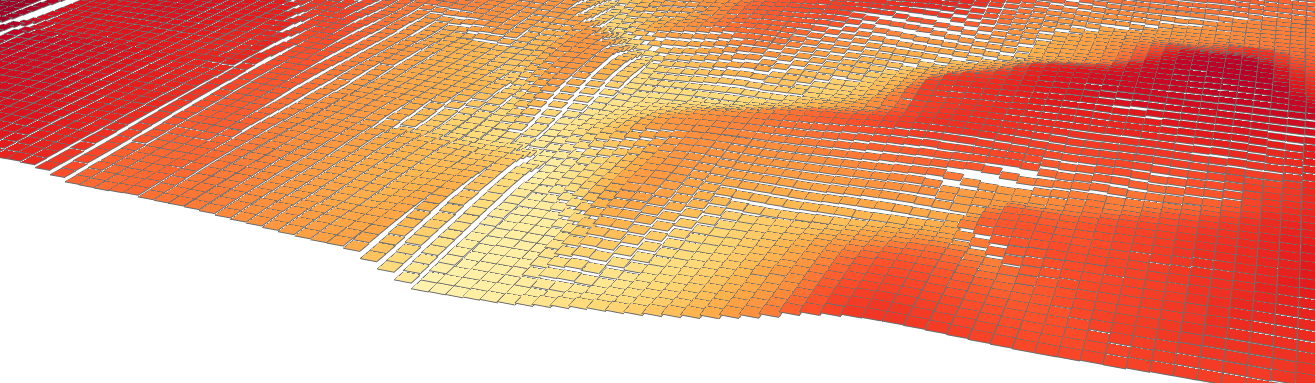
MY_3D_POINTS and MY_3D_LINES are your final results. Add them to ArcScene to look at them in 3D.  ArcScene should be installed since you have the 3D Analyst extension. Or, add them to ArcGIS Pro with a 3D extension.

If you chose Option A, some vertices of some lines will be at the fixed elevation you chose. Some lines will be entirely at that elevation.   You should work to collect truer data at those spots to have better 3D data.

If you chose Option B, some lines will unexpectedly slope up or down to an average elevation for the feature. Some lines will be at elevation 0 or NULL. You should work to collect truer data at those spots to have better 3D data.

"Roj"

Roger Dunn

Senior GIS Programmer/Analyst

City Manager's Office/Information Technology Division

City of Orem, Utah

more
1 0 5,880
by Anonymous User
Not applicable

At current the Create LAS Dataset and Add Files to LAS dataset geoprocessing tools in ArcGIS Pro have a difficult time reading large numbers on LiDAR tiles on external drives.

Users often keep LiDAR on a seperate SSD drive from their machine's local drives if:

1.) Space is limited on the users machine and/or the entire dataset is too massive to load locally

2.) The user does not have time to wait 3, 4, or even 7 hours + for the data to transfer to the local machine.

Just create and empty las dataset with the create las dataset GP tool and then run the following script to load all files into the LAS Dataset.

import arcpy
import os

inLASDataset = r'C:\MyLASDataset.lasd'
inLASFolder = r'H:\MyLASFolder'
extension = ".zlas"  # ".zlas", ".las"

LASFileString = ""
for file in os.listdir(inLASFolder):
    if file.endswith(extension):
        LASFileString += (";" + os.path.join(inLASFolder, file))

arcpy.AddFilesToLasDataset_management(inLASDataset, r"{0}".format(LASFileString), "NO_RECURSION",
                                      None)

del LASFileString

Depending on the file size the process may take several minutes.

Grab some coffee with the comfort of knowing you don't have to manually load the files in chunks

more
1 0 372
by Anonymous User
Not applicable

At Esri, we constantly receive the question "can Esri software generate 3D gridded terrain tiles from elevation rasters".  Well, the answer is yes!

Whether you are a 3D environment artist focusing on film, gaming, or rendering, an AEC Professional, or GIS expert interested in a non-TIN based approach to terrain surface generation you will find the following post helpful.

The following workflow requires ArcGIS Pro and Esri CityEngine.

Process:

  • Create a new ArcGIS Pro Project.
  • Install the Toolbox in ArcGIS Pro
    • Download the "Generate3DTerrainGridTools" here: gen3DTerrainGrid.zip - Box 
    • Unzip the .zip folder to your computer at your location of choice.
    • In the "Catalog" tab in ArcGIS Pro "Right Click" on "Toolboxes" and select "Add Toolbox"
    • Search for the toolbox within the folder you extracted.
    • You should now see the script tools in the toolbox in ArcGIS Pro catalog.
    • Open the "Generate 3D Terrain Grid" tool
      • Input your DEM Raster, choose the Output GeoDatabase, and Output Feature Class Name and click "RUN"
      • The output will be convert your raster pixels to 3D polygons at their respective elevation.
      • You can symbolize the data if your want, use the extrude tool in the "genTerrainGrid toolbox" to create a voxel representation or continue to the next step below to continue creating a watertight 3D Mesh.
    • Run the "Convert 3D Grid to Multipatch" GP tool
      • input the Grid3DPolygons from the previous tool and select the output location for the Multipatch Grid. 
      • **Processing time will depend on the number of total polygons.
      • The resulting data is a single MultiPatch feature.
  • Lastly, if you want to place imagery on the final model you can do this by clipping the raster/s to the extent of the Grid3DMP feature
  • Download the following CityEngine Project files here: texture3DGridCE.zip - Box 
    • In CityEngine Navigate to File --> Import:
      • Choose "Existing Projects into Workspace"
      • "Select Archive File" and Import the "texture3DGridCE.zip"
      • You will now see the "Texture3DGrid" Project in the "Navigator" panel in CityEngine
      • Either Create a new Scene or open the default "TestScene.cej" file.
      • Select File--> Import --> File GDB Import
      • navigate to your ArcGIS Pro project and import the file Geodatabase you saved the "Grid3DMP" file to.
        •  Select only the Grid3DMP file or whatever you named the multipatch file and click Finish.
        • The Grid will be loaded into CityEngine.
      • With the Grid Still Selected navigate to "Shapes --> Cleanup Shapes"
      • Select only "Merge Vertices" and set the "Distance Tolerance" to slightly less than the geometry width or height depending on which is smaller. Also keep in mind CityEngine is in Metric so if your data is in feet you need multiply the value by 0.3048.
      • Click finish and your result will be as follows:
      • In some circumstances the distance between vertices is greater than the width of pixels. In these cases just manually select the vertice point, move it closer to the above point and re-run the cleanup shape process.
      •  

The Cityengine process above and below can also be automated with python scripting. We are looking to implement this soon.

  • Texturing the Terrain in CityEngine.
    • Copy your .tif or .jpg files you clipped rasters to from the previous process in ArcGIS Pro to the "maps" folder in your CityEngine Project.
  • Drag and Drop the Hillshade.tif file into the viewport but do not import the files. We just want to note the X size and Z size values. This is the Length and Width of the Raster.
  • Drag and Drop the "textureFeatureFromOrtho.cga" rule on the 3D model.
  • Click on the 3D Model and the procedural rule options will appear in the inspector
  • Update the raster height and raster width the raster width and height numbers you noted earlier (X, Z)
  • Under the drop down next to "rasterLocation" use the "browse" option to select the raster you want to texture the model with. Be sure not to mix-up the rasterHeight and rasterWidth values or the image will tile several times on the geometry.
  • The texture model should look as follows: 

Exporting the Model for 3rd party programs, SceneLayer Package, or to GeoDatabase to migrate back to ArcGIS Pro.

  • Select the model and go to File--> Export or select "Ctrl+E" to open the file export settings dialogue.
    • Select your format of choice and check your ideal settings and export the models
    • The models by default will be placed in the "model" folder of your CityEngine Project.

more
2 5 1,843
ChadKopplin
Occasional Contributor III

One of the projects that I am working on is developing a Nitrate Vulnerability model for Laramie County in SE Wyoming.  We are using a modified version of the EPA's DRASTIC model, which takes into account Land Use, in the model.  If anyone has ever done this please let me know parameters that you used and any issues that you may have run into.

more
1 0 408
by Anonymous User
Not applicable

With the emergence of more severe climate events, 3d Resilience solutions are of highest importance. 

A recent study undertaken by researchers from Princeton and Rutgers universities, found that along all of the U.S. coastline, the average risk of a 100-year flood will increase 40-fold by 2050.


The following tools and solutions can be leveraged by any government agency to model 3D flood exposure.

The tools require FEMA flood data following the May, 2014 FEMA Guidance for Flood Risk Analysis and Mapping | Flood Depth and Analysis Grids Standards to Generate a 3D Flood Grid and attribute Polygon and 3D models with Risk attributes.

Flood Tools

     San Antonio, Texas 3D Flood Model generated with Esri 3D Risk Modeling Tools.

The 3D risk Tools require access to Water Surface Elevation Level (WSEL) Grids and Depth Grids.

Image Source: FEMA

Depth Grids must exist for levels 02%, 1% 2% 4%, 10% annual chance flood events

Download the 3D Risk Tools here: Risk_Tools_3D.zip - Box 

- Extract the toolbox and map to the toolbox in ArcGIS Pro.

      - More information on how-to map to toolboxes

Generating the 3D flood Grid

1.) Run the Generate Water Hexbins GeoProcessing tool.

      - Input a Polygon covering the area you want to generate a grid for

      - The default Units of the input polygon specify the units of the grid area Size.

      - Grid Area is in units square ex: 1000 sq feet shown below

2.) Run the Flood Grid Attributor GeoProcessing tool.

      - Input the waterHexbins Grid generated in the previous tool

      - Input the % Water Surface Elevation and Depth Rasters

3.) Run the Flood Grid 2 AGOL/Portal GeoProcessing tool

      - Input the Attributed Hexbin Grid from the previous process

      - Set the Scratch folder for outputting files to

      - Determine whether or not you want:

  • Only Multipatches to be generated "retain 3D Grids"
    • Only if interested in viewing in ArcGIS Pro
  • Scene Layer Package
    • 3D Format for sharing models on ArcGIS Online or Portal
  • Share Package
    • If you wish to Upload the Scene Layer Package to ArcGIS Online

  • Publish the Layers on ArcGIS Online
  • Add the Layers to a 3D WebScene
  • Set Opacity to Layer
  • Set Color to Blue

Result = 3D Gridded Plane denoting Water Surface Elevation attributed with Depth and other values.

** Note you can also manually manipulate the Grid after step 2 above instead using Appearance and Symbology in ArcGIS Pro**

Attributing Multipatch Features and Polygon Data with Flood Level attributes:

**Note: If you do not have 3D models use the Esri Local Gov 3D Basemaps Solution to Generate 3D Building from LiDAR.

** Esri can also accurately model your city in 3D from available LiDAR. Contact me: gtaylor@esri.com for more info...

1.) Run the Water Surface Elevation Attributor GeoProcessing tool.

      - input Multipatch Building or Polygon Feature

         ex: 3D Building, Building Footprint, Parcel, Block Group etc...

      - Select the FeatureID.

         - FeatureID cannot be a String (Text) based value.

      - Input the % Water Surface Elevation and Depth Rasters

      - Input the Digital Elevation Model (DEM) Raster

2.) Use Join or Relate Operations to Join the Table to the Footprints by FeatureID

3.) Use Symbology to color the 3D Building models by Attribute

Slicing Building Floors and Attributing floors with Flood data

Requirement: 3D Building models in Multipatch format.

1.) Download the FacilityTools located here: https://community.esri.com/people/GTaylor-esristaff/blog/2016/01/13/create-floors-from-3d-building-m... 

2.) In the Facility Tools Toolbox run the Split Floors GP tool on the 3D Multipatch Buildings

3.) In the 3D Risk Tools toolbox Run the Water Surface Elevation Attributor (Building Floors) GP tool

   - Input Building Footprints

   - Select floorID

   - Select buildingID

   - Input the Building Flood Table generated in Step one of this process

   - Select the buildingID

4.) Use Join or Relate Operations to Join the Table to the Footprints by FeatureID

5.) Use Symbology to color the 3D Building models by Attribute

Results = 3D Buildings with floors attributed with flood data

I will be updating this post with more in-depth instructions as time permits.

Best to get the tools out early to help Cities worldwide model Risk in 3D to further enable discussion leading to Resilient solutions.

If you have any questions regarding the tools please leave a comment below and I will respond as soon as possible.

Hope you find these tools helpful!

more
6 0 2,821
by Anonymous User
Not applicable

Over a year ago I published an article on Extracting Floors from 3D Buildings.

https://community.esri.com/people/GTaylor-esristaff/blog/2016/01/13/create-floors-from-3d-building-m... 

I have added two new updates to the tool.

1.) Generate Rooms GP tool:


This tool leverages an a CityEngine .rpk file for rapidly creating fake rooms.

You can then use the included "Extrude" GP tool to extrude the volumes:

I have also included a tool for randomly attributing the Rooms, Floors, etc... with Data such as Owner and Value.

The results of this attribution are shown above.

The python file and Demo-Attributor tool are meant to serve as an example for random application of values to features in ArcGIS Pro.

Hope you find these helpful!

A download link to the tools and how to install them in pro can be accessed here :https://community.esri.com/people/GTaylor-esristaff/blog/2016/01/11/extrude-gp-tool 

more
2 1 1,019
by Anonymous User
Not applicable

As more and more organizations are obtaining High Density Airborne LiDAR, the opportunity to automate the extraction of Critical Infrastructural Data such as building footprints from such rich point-cloud is possible.

With properly classified LiDAR it is feasible to directly extract items of individual or multiple class codes into polygonal features. These class codes are used to seperate and denote features such as buildings, ground, bridges, vegetation, water, etc....

Learn More about LiDAR Class Codes here: Lidar point classification—Help | ArcGIS for Desktop 

Using the "Attached" BuildingFootprintXtract toolbox for ArcGIS Pro, you can run through a 3 step process for generating building footprints from massive LiDAR Datasets.

Instructions:

Using ArcGIS Pro ensure that your Buildings are Classified in your LiDAR .las or .zlas files.

  • You can visually assess Building Classification in the LiDAR Classification as Class Code 6 

Run the LiDAR to Raster Tiles GP tool in the "Attached" BuildingFootprintXtract toolbox:

** The cell-Size will depend on the LiDAR Point Spacing. I typically run 2ft or 0.6096 meters here.**

*****We are currently in the process of optimizing this tool to process on multiple cores.******

Run the Tiles to Mosaic Dataset tool in the "Attached" BuildingFootprintXtract toolbox:

Run the Extract Footprints Polygons tool in the "Attached" BuildingFootprintXtract toolbox:

** Note the small artifacts that may exist where points were miss-classified in the LiDAR as buildings.**

To eliminate these.....

Run the Eliminate Polygon Part GP tool:

** I typically remove features smaller than 60sq meters or 645 feet.. **

In Some Cases Holes will exist in the middle of features where LiDAR point-clouds were either miss-classified or were non-existent. 

To remove these holes run the "Eliminate Polgon Part" GP tool


Final Step:

Footprint Regularization.

For further refinement of the extracted buildings please refer to Arthur Crawford's blog post concerning increased accuracy regularization of the extracted footprints:

https://community.esri.com/people/acrawford-esristaff/blog/2016/12/22/arthurs-feature-extraction-fro...

Also, special thanks to Arthur for some of the key concepts behind the mosaic-approach to the footprint extraction process integrated leveraged in this toolbox.

To learn more about working with LiDAR come see us at the Esri IMF?

www.esri.com/IMF

more
3 0 4,546
by Anonymous User
Not applicable

Agencies abound have collected geolocated data on existing assets.... Whether the data is Point, Line, or Polygon in nature this data can be leveraged to rapidly generate 3D Model representations of Place. Often, this data lacks directional information required to accurately rotate models to the appropriate position. The easiest way to solve this is leveraging centralized features to detect directional alignment.

This post will cover the simplest example of feature alignment.

Obtaining directional information for street assets (points) leveraging street center-lines.

** The following Point-Data and Street Data were obtained from LiDAR for PeachTree Corners GA by CH2M Hill**

Obtaining directional information from street center-lines is as easy as running the "Near GP tool"

Just enter the following:

  • Street asset point data as "Input Feature"
  • Street-Centerline polygon as the "Near Feature"
  • Apply a search radius of your liking you fill will encompass the full width of the largest street and street furniture
  • Enable "Location" and "Angle" to be calculated
  • Use default "Planar" Method for calculation.

In python this operation resembles:

import arcpy

inputPoints = r'MyPointFeature'

inputCenterlines = r'MyCenterlinePoly'

arcpy.analysis.Near(inputPoints, inputCenterlines, "100 Feet", "LOCATION", "ANGLE", "PLANAR")

The resulting calculations are parsed into the points featureclass as:

Delete fields

  • NEAR_FID, NEAR_DIST, NEAR_X, NEAR_Y
    • This only leaves NEAR_ANGLE

Use the "AlterField" GP tool to change the filed called "NEAR_ANGLE" to direction.

In python this operation resembles:

arcpy.AlterField_management(inputPoints, "NEAR_ANGLE", "direction", None, "DOUBLE", 8, "NULLABLE", True)\

Your final table update should resemble something similar to the following:

Also use the "Add Field" GP tool to add a a field called "Height" and "Calculate Field" GP tool to apply a generic height to all points. You can update with accurate heights in the future or parse existing height data to the field if available.

Next Highlight your point features in the "Contents" Panel

On the right Side Panel select "Symbology" to open the Symbology Options:

Select the Symbol Icon

Select the "Structure Icon.... It resembles a wrench

Select "Add Symbol Layer" and choose "Procedural Layer"

Click the "Layers" Icon

Choose to "Add a Procedural Rule"

Apply the "StreetLight_Single.rpk" CityEngine Rule Package file.

You can find the .rpk file as a attachment to this blog post.

The results should resemble the following:

You can then view the rule in context to other data you may have.

If you want to add the 3D Models to ArcGIS Online workflow:

  • Features from CityEngine rules GP tool.
  • Create Scene Layer Package
  • Share Package

The Rule Package you just applied to the point data leverages what is called CGA Shape Grammar. To program and edit such .rpk files requires a CityEngine Basic License. 

You can download a 30 Day free trial of CityEngine here: Esri CityEngine | 3D Modeling Software for Urban Environments 

Here is the code to generate the completely procedural light post above.

/**
* File: LampPost.cga
* Created: 6 Mar 2017 15:33:53 GMT
* Author: Esri
*/

version "2016.1"

attr height = 25

attr direction = 0

attr postDiameter = 1

attr boomDiameter = 0.9

attr boomDistance = 12

attr boomAngle = 25

attr numberLamps = 1

@Range("Feet","Meter")
attr units = "Feet"

@Color
attr postColor = "#000000"

unitConv =
case units == "Feet": 0.3048
else: 1

directionMod =
case direction > 0: direction + 90
else: direction + 90

@InPoint
@StartRule
basePost-->
alignScopeToAxes(y)
primitiveCube()
s(postDiameter*unitConv, height*unitConv, postDiameter*unitConv)
#s('1,height*unitConv,'1)
rotate(rel, world, 0, directionMod, 0)
center(xz)
upperConnector

upperConnector-->
split(y){(height*unitConv) - (boomDiameter*unitConv): colorPost | ~1: upperConnectorStart}

upperConnectorStart-->
comp(f){
top: colorPost |
bottom: NIL |
front: lightBoomGeom1 colorPost |
back: colorPost X. |
left: colorPost X. |
right: colorPost X.
}


lightBoomGeom1-->
alignScopeToAxes(y)
t(0,0,-(boomDiameter/2))
r(scopeCenter, - boomAngle, 0, 0)
#rotate(abs, object, 0, 0, 90)
lightBoomGeom

lightBoomGeom-->
split(x){(postDiameter-boomDiameter)/2: colorPost | ~1: lightBoom | (postDiameter-boomDiameter)/2: colorPost}


lightBoom-->
extrude(boomDistance*unitConv)
lightBoom_lamp

lightBoom_lamp-->
rotateScope(45, 0, 0)
rotateScope(0, 0, 45)
split(y){(boomDistance*.4)*unitConv: colorPost |(boomDistance*.6)*unitConv: lamp}

lamp-->
alignScopeToAxes(y)
comp(f){
top: colorPost |
bottom: insetLamp |
front: colorPost|
back: colorPost |
left: colorPost |
right: colorPost
}

insetLamp-->
offset(-0.1*unitConv) A

A-->
comp(f) { inside: light | border: colorPost }

light-->
color("#FFFF00")


colorPost-->
color(postColor)

more
1 0 885
86 Subscribers