- Home
- :
- All Communities
- :
- Products
- :
- ArcGIS Spatial Analyst
- :
- ArcGIS Spatial Analyst Questions
- :
- Display A Slope Raster
- Subscribe to RSS Feed
- Mark Topic as New
- Mark Topic as Read
- Float this Topic for Current User
- Bookmark
- Subscribe
- Mute
- Printer Friendly Page
Display A Slope Raster
- Mark as New
- Bookmark
- Subscribe
- Mute
- Subscribe to RSS Feed
- Permalink
ArcGIS Pro 2.5
This is new territory for me; I haven't created surfaces since ArcInfo 6.x with TINs....
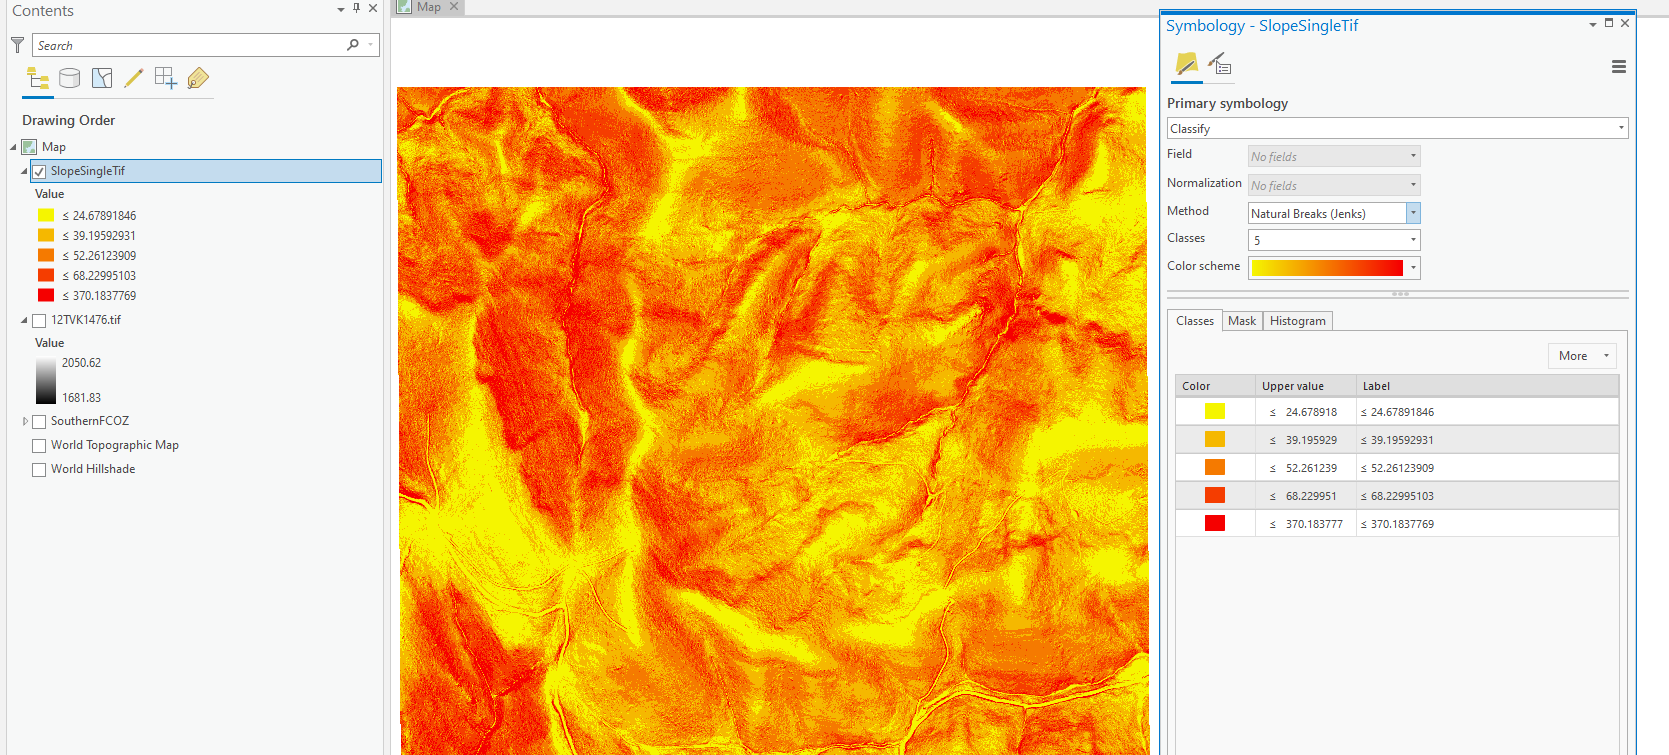
I have a number of tif rasters that I am attempting to create a slope analysis from. I think I've created what I want, but I don't understand how to display it in a map. Basically I want to show slopes less than 25% in green, 25%-35% in yellow and anything greater than 35% in red. See screen capture below.
I took a look at https://community.esri.com/message/895485-re-slope-percent-symbology?commentID=895485#comment-895485 but it applies to ArcMap, and I don't see a clear correlation to ArcGIS Pro.
The original tif raster has elevation in meters, hence the range of 1681-2050. Using the Spatial Analyst tool box, I just used the Slope geoprocessing tool; entered my input raster, output raster, setting my output measurement to Percent Rise. So far so good.
Choosing Classify as the 'Primary symbology' scheme, I can only set the number of breaks; what are the units it is displaying? How do I display my slope raster described above?
- Mark as New
- Bookmark
- Subscribe
- Mute
- Subscribe to RSS Feed
- Permalink
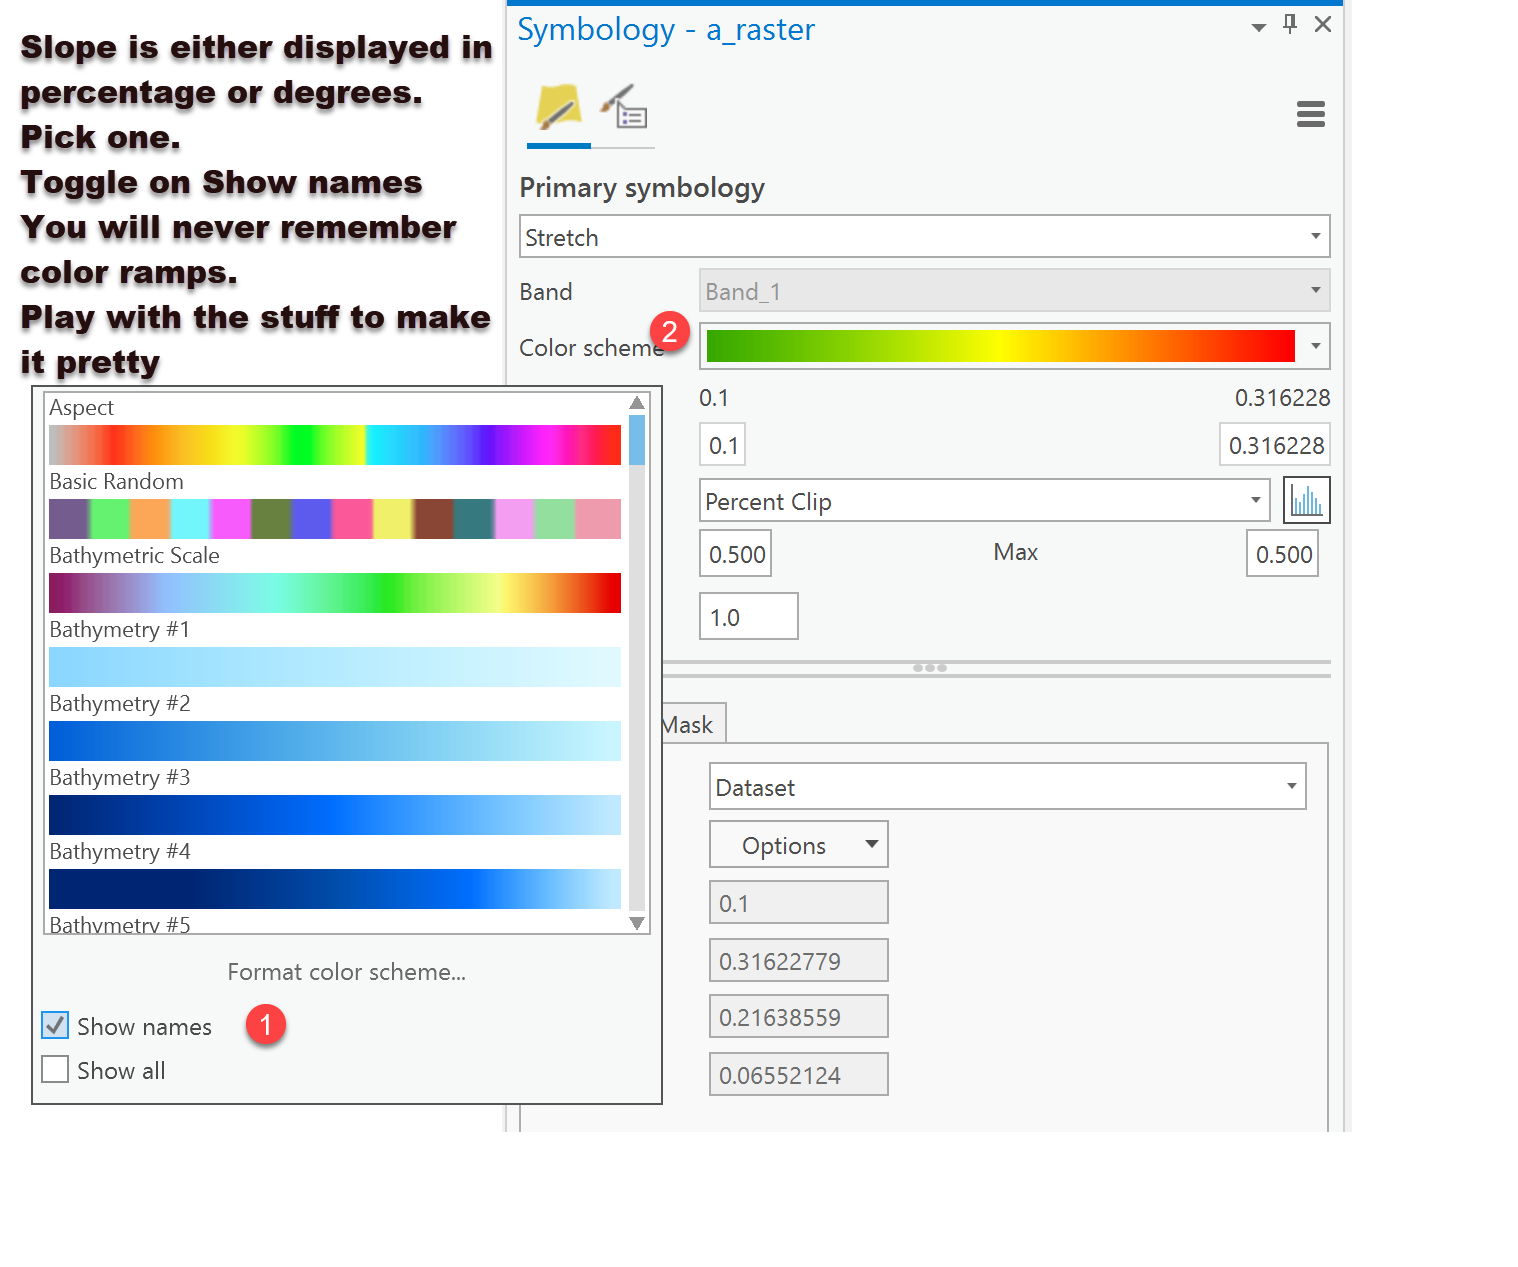
Slope in either degrees or percent... 45 deg = 100%
Show names is the key... there others as well
- Mark as New
- Bookmark
- Subscribe
- Mute
- Subscribe to RSS Feed
- Permalink
Hi Joe Borgione,
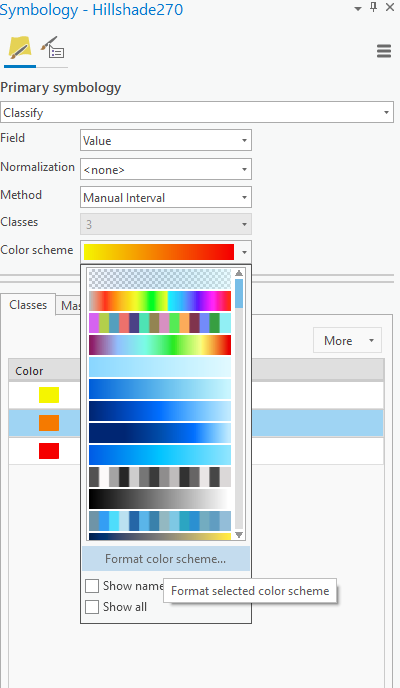
You are correct in converting your slope raster into % rise. Once you have set the amount of breaks you want, change the method to manual interval. Then specify the upper values of each by clicking on the values and changing them for each class like the image below.

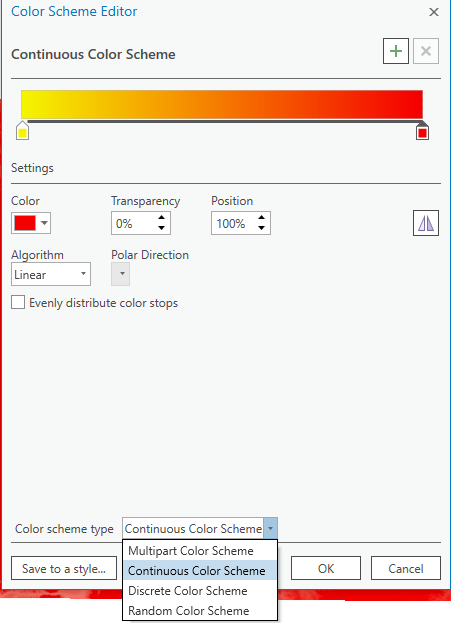
This then lets you change the colour for individual classes. You can also go into the color scheme and format it using more complex options. As seen below.
Good luck! I hope this helped answer your question.
Shane
- Mark as New
- Bookmark
- Subscribe
- Mute
- Subscribe to RSS Feed
- Permalink
Thanks for the replies, but I'm still missing something:
Dan Patterson I try your suggestion but I'm still faced with the values I don't understand:
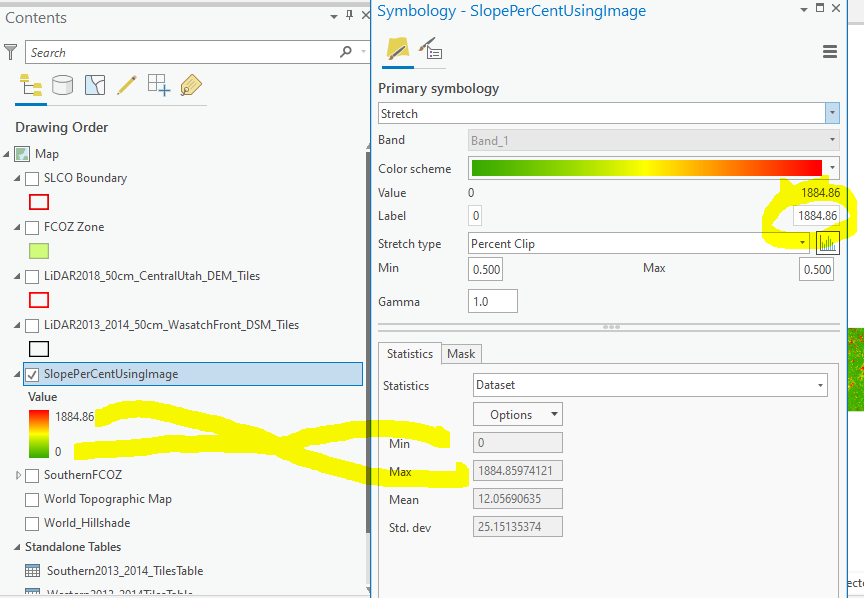
Shane Miles: I pick 3 classes and then switch to Manual Interval but the Field pulldown is still grayed out. As you can see I change the the two values as you describe, but then there is that 1884 value once again that I have now idea what it is telling me.

I don't know if I have create the slope raster incorrectly or not; it seems like a fairly straight forward process. I'll get on a screen share with tech support and see what I'm doing wrong.
Here is a screen shot of my slope raster showing two parallel tow land limited access highways. My assumption is the slope if these items would be minimal, however as indicated by the popup, the value is 581 and some change (what ever that means).

Thanks-
- Mark as New
- Bookmark
- Subscribe
- Mute
- Subscribe to RSS Feed
- Permalink
1884 is the slope in percent rise. Reaaaalllly steep. But I am guessing you understand that.
Doesn't take much using a D8 configuration to get that value, you are moving close to infinity percentwise.
Have you narrowed down where you are getting those slope values? Along the ridges probably.
Why not calculate slope in degrees to have a look. 90 degrees would be a cliff an 80 degree slope gives 567 is percent.
Doing a manual classification is the best to use if you are using this for planning/zoning purposes (ie a driveway can't exceed 13% for a 10 meter run)
- Mark as New
- Bookmark
- Subscribe
- Mute
- Subscribe to RSS Feed
- Permalink
I get that... sort of. When I look at those two two-lane roads, a value of 581 translates to a slope of 80 degrees. That just doesn't make a whole lotta sense to me....
- Mark as New
- Bookmark
- Subscribe
- Mute
- Subscribe to RSS Feed
- Permalink
It does to me... steep ditches with DEM's derived from hires sources. The ditches entering our village are near vertical.
Also 'phantom' dem values, like elevations from telephone poles. Don't assume that the dem is 'clean', especially in the era of lidar... all those cool rectangular boulders at the edge of roads 
- Mark as New
- Bookmark
- Subscribe
- Mute
- Subscribe to RSS Feed
- Permalink
Been doing a bit more work with this; I now understand that percent rise can go to infinity (and beyond!). Also, it turns out that those features I thought were roads are in fact overhead power lines with towers along the way; the steepness values make sense there! As I pan around and zoom in I am seeing all sorts of anomalies as you mentioned; building footprints, trees, etc....
- Mark as New
- Bookmark
- Subscribe
- Mute
- Subscribe to RSS Feed
- Permalink
so the source isn't 'bare earth', contact the source for a better source of data, you can't 'clean' it up without filling/removing real things like ditches
- Mark as New
- Bookmark
- Subscribe
- Mute
- Subscribe to RSS Feed
- Permalink
That's another thing I need to figure out. It's great being a 63 yo rookie...