- Home
- :
- All Communities
- :
- Products
- :
- ArcGIS Spatial Analyst
- :
- ArcGIS Spatial Analyst Questions
- :
- Display A Slope Raster
- Subscribe to RSS Feed
- Mark Topic as New
- Mark Topic as Read
- Float this Topic for Current User
- Bookmark
- Subscribe
- Mute
- Printer Friendly Page
Display A Slope Raster
- Mark as New
- Bookmark
- Subscribe
- Mute
- Subscribe to RSS Feed
- Permalink
ArcGIS Pro 2.5
This is new territory for me; I haven't created surfaces since ArcInfo 6.x with TINs....
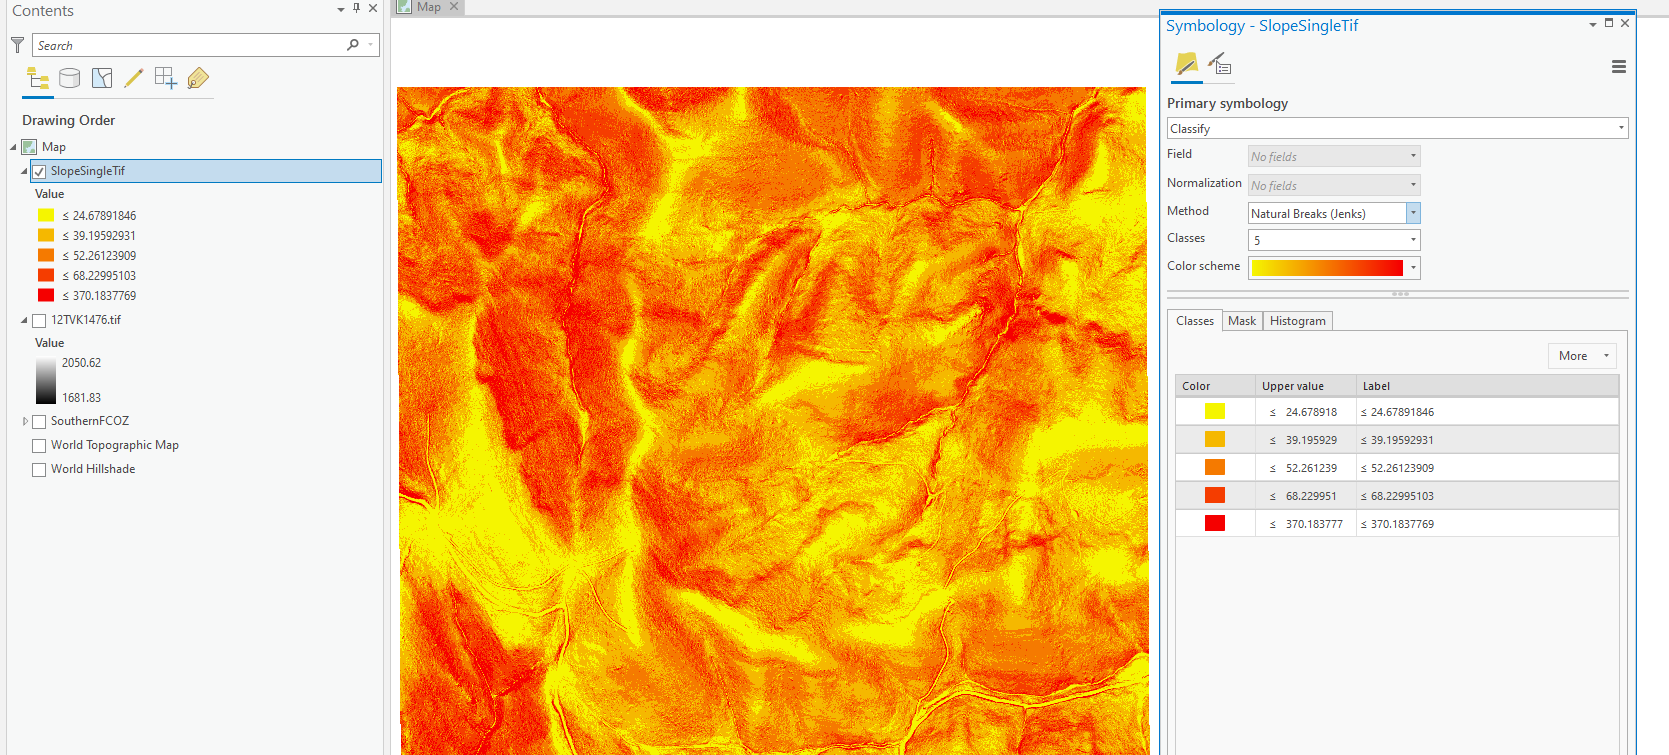
I have a number of tif rasters that I am attempting to create a slope analysis from. I think I've created what I want, but I don't understand how to display it in a map. Basically I want to show slopes less than 25% in green, 25%-35% in yellow and anything greater than 35% in red. See screen capture below.
I took a look at https://community.esri.com/message/895485-re-slope-percent-symbology?commentID=895485#comment-895485 but it applies to ArcMap, and I don't see a clear correlation to ArcGIS Pro.
The original tif raster has elevation in meters, hence the range of 1681-2050. Using the Spatial Analyst tool box, I just used the Slope geoprocessing tool; entered my input raster, output raster, setting my output measurement to Percent Rise. So far so good.
Choosing Classify as the 'Primary symbology' scheme, I can only set the number of breaks; what are the units it is displaying? How do I display my slope raster described above?
- Mark as New
- Bookmark
- Subscribe
- Mute
- Subscribe to RSS Feed
- Permalink
Joe, to answer your question directly about percent units, the units of slope are rise over run. If the DEM is in geographic, your slope values are invalid and really really high because the x is in degrees (makes no sense) and the y is in meters or feet. The way to fix this is to project the raster to a projected coordinate system like UTM, so units in x and y are the same. May not be your issue, but I thought I'd add that to the thread.
- Mark as New
- Bookmark
- Subscribe
- Mute
- Subscribe to RSS Feed
- Permalink
Thanks Curtis; I don't have the data open at the moment, but it should be all utm and meters. The elevation values make sense in that respect.
- « Previous
-
- 1
- 2
- Next »
- « Previous
-
- 1
- 2
- Next »