- Home
- :
- All Communities
- :
- Products
- :
- Mapping and Charting Solutions
- :
- Mapping and Charting Questions
- :
- Set meaningful break value in divergent color ramp
- Subscribe to RSS Feed
- Mark Topic as New
- Mark Topic as Read
- Float this Topic for Current User
- Bookmark
- Subscribe
- Mute
- Printer Friendly Page
Set meaningful break value in divergent color ramp
- Mark as New
- Bookmark
- Subscribe
- Mute
- Subscribe to RSS Feed
- Permalink
- Report Inappropriate Content
In ArcPro, I'm trying to set the mid value of a divergent color ramp to "0". (And I have spent enough time searching the web for a solution...)
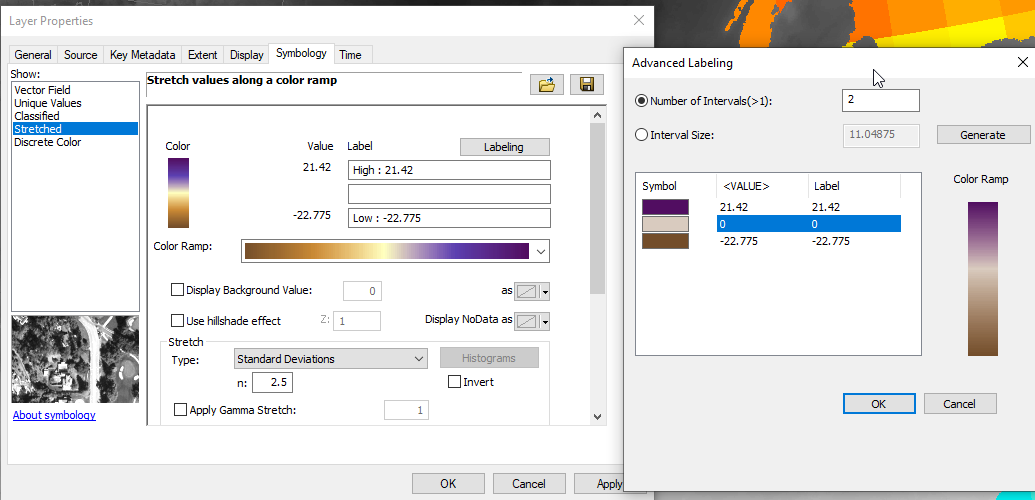
This is very easy in ArcMap: Raster layer properties > Symbology tab > Stretched LAbeling button > Number of Intervals = 2 > Set the mid color value to "0". This offsets the mid value so that the colors on one end of the divergent color ramp represent positive values and the color at the other end of the divergent ramp represent negative colors.
I don't see a way to either create intervals for the color ramp or to used advanced labeling to set midpoints between the min and max raster values.
How do I force the "white" mid color of a divergent ramp to represent "0" in my range of values from negative to positive?
Thank you~
- Mark as New
- Bookmark
- Subscribe
- Mute
- Subscribe to RSS Feed
- Permalink
- Report Inappropriate Content
I have this same problem today & the features we need dont seem to exist in ArcPro
https://community.esri.com/thread/196362-where-is-edit-highlow-values-in-arcgis-pro
- Mark as New
- Bookmark
- Subscribe
- Mute
- Subscribe to RSS Feed
- Permalink
- Report Inappropriate Content
I also have this question - any update from Esri? The real advantage of a divergent color ramp is that the center means something. Without being able to set that center (in my case also to 0), is there a point in having divergent color ramps?
- Mark as New
- Bookmark
- Subscribe
- Mute
- Subscribe to RSS Feed
- Permalink
- Report Inappropriate Content
Update: here's a good solution I got from an Esri friend. For reference, my raster values went from -1 to 0.796.
In the Primary Symbology Pane for your raster, you’ll need to go to the Statistics panel towards the bottom. There is a dropdown menu titled “statistics”. Change it from “Dataset” to “Custom”. Look at your min and max values for whichever has the greatest absolute value, and then set min to the negative of that number and max to the positive of that number. In your case you’ll want Min to be -1 and Max to be 1. This will ensure that:
- zero is the center of your color scheme
- your min or your max is at one end of the color scheme (in your case, the minimum is the left end)
- the remaining point is somewhere between the center and the remaining end (in your case, the max is between the middle and the right end)
If you want to make sure that your desired color is used for your maximum, you can open the dropdown for the color scheme and click “Format Color Scheme”. You conveniently have values between -1 and 1, so it’s relatively simple to get the maximum value’s position in the color scheme. It will be 1 - ((1 - 0.796) / 2) = 89.8%, so you can select the leftmost color stop on the gradient and then type this value into the Position field. The stops for -1 and 0 should remain at 0% and 50%.
- Mark as New
- Bookmark
- Subscribe
- Mute
- Subscribe to RSS Feed
- Permalink
- Report Inappropriate Content
Hi Sam, I can't find the dropdown menu titled “statistics”. The only thing I have about stats in the symbology is to see the count, mean, max, etc, but it doesn't have any functionality. I'm working with a feature class, does your workaround only with rasters?
Can you please share a screenshot of what the menu looks like?
- Mark as New
- Bookmark
- Subscribe
- Mute
- Subscribe to RSS Feed
- Permalink
- Report Inappropriate Content
It seems like this problem has now been fixed with an update, so I wanted to post something here for anyone looking in the future. This can now be done in the "Advanced Labeling" section in the bottom half of the symbology tab. You can add the desired number of intervals (in the cases described here, 2 would be appropriate) and set the values associated with each color.