- Home
- :
- All Communities
- :
- Industries
- :
- State & Local Government
- :
- State & Local Government Questions
- :
- How does the contour tool (3D Anaylst) work in det...
- Subscribe to RSS Feed
- Mark Topic as New
- Mark Topic as Read
- Float this Topic for Current User
- Bookmark
- Subscribe
- Mute
- Printer Friendly Page
How does the contour tool (3D Anaylst) work in detail?
- Mark as New
- Bookmark
- Subscribe
- Mute
- Subscribe to RSS Feed
- Permalink
- Report Inappropriate Content
Hello,
can anybody give me additional information on how contouring (3D Analyst) in ArcGIS works?
Looking at the explanations within the help files I got no satisfying answer. I derived a contour from a raster with a resolution of 1 m and a base contour located at 0.05 m above mean sea level.
Is it a TIN-interpolation based on the cell center points? I wonder why the distances between the vertices (contour) are so irregular...
Any information on how the contour-tool works in detail would be great!
Best regards
Thorsten Dey
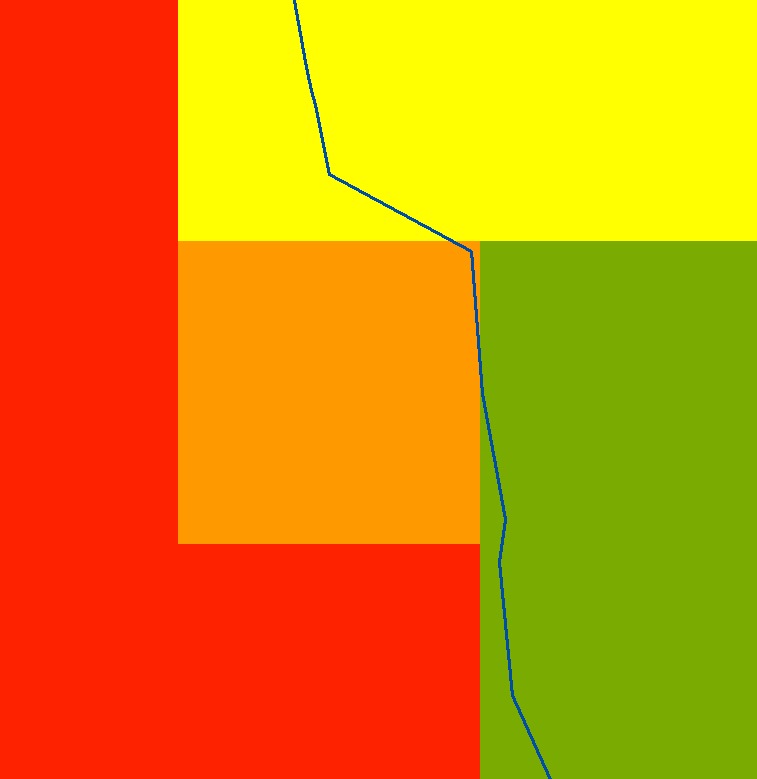
this is how it looks like...
Solved! Go to Solution.
Accepted Solutions
- Mark as New
- Bookmark
- Subscribe
- Mute
- Subscribe to RSS Feed
- Permalink
- Report Inappropriate Content
We have a raster with pixel values = 799; 802; 791, etc. and we want a contour line at 830 (for example).
The algorithm bisects each pixel and calculates the value at each node (814; 809; 838; 834).. It'll then determine where on these lines the value=830 (see red dots) and then finally construct the polyline which is the 830 contour.
Contouring is like slicing a potato, each slice = contour 🙂
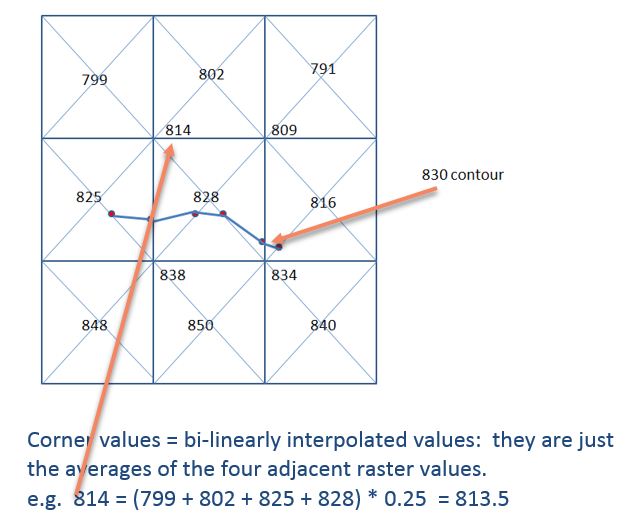
This applies to the Contour tool in Spatial/3D Analyst.
- Mark as New
- Bookmark
- Subscribe
- Mute
- Subscribe to RSS Feed
- Permalink
- Report Inappropriate Content
a partial answer to contours found in the Contour tool's How Contouring works about the shifting of the line from the raster cell is given in the link. One of those you have applied (base contour). Then the main page refers to how the input extent and data being contoured can have an impact.. Any misalignment of the cell contours triggers a bilinear resampling of the input data See here The actual algorithms being used? I can't find specific references except for those found here
Lancaster, P. and Šalkauskas, K. Curve and Surface Fitting: An Introduction. London: Academic Press, 1986.
Burrough, P. A., and McDonell, R. A., 1998. Principles of Geographical Information Systems (Oxford University Press, New York), 190 pp.
David Eberly 1999. Least Squares Fitting of Data (Geometric Tools, LLC), pp. 3.
in this section.....
Perhaps if you had a 'generated surface' you might be better able to assess what happens when actual terrain is being interpolated.
Maybe slynch-esristaff can direct you to specific references to the methods used
- Mark as New
- Bookmark
- Subscribe
- Mute
- Subscribe to RSS Feed
- Permalink
- Report Inappropriate Content
We have a raster with pixel values = 799; 802; 791, etc. and we want a contour line at 830 (for example).
The algorithm bisects each pixel and calculates the value at each node (814; 809; 838; 834).. It'll then determine where on these lines the value=830 (see red dots) and then finally construct the polyline which is the 830 contour.
Contouring is like slicing a potato, each slice = contour 🙂
This applies to the Contour tool in Spatial/3D Analyst.