- Home
- :
- All Communities
- :
- Developers
- :
- JavaScript Maps SDK
- :
- JavaScript Maps SDK Questions
- :
- Delete Graphic in Edit Mode Retains Vertices on Ma...
- Subscribe to RSS Feed
- Mark Topic as New
- Mark Topic as Read
- Float this Topic for Current User
- Bookmark
- Subscribe
- Mute
- Printer Friendly Page
Delete Graphic in Edit Mode Retains Vertices on Map - Possible Bug
- Mark as New
- Bookmark
- Subscribe
- Mute
- Subscribe to RSS Feed
- Permalink
Using the JavaScript API (currently using version 3.15).
I draw a graphic on the screen. Then I call the editor tool to edit the graphic.
If I delete the graphic while the editor tool is enabled, the graphic disappears, but the edit tool vertices remain on the map.
Not sure if this is by design, or just something the developers overlooked.
The only way to terminate the edit mode and remove the vertices from the map is to select a different graphic for editing.
It seems to me that if the graphic is deleted, the edit mode should be terminated on that graphic naturally.
- Mark as New
- Bookmark
- Subscribe
- Mute
- Subscribe to RSS Feed
- Permalink
Kathleen,
I can not duplicate what you are seeing in either of these samples that use 3.15
http://developers.arcgis.com/javascript/samples/ed_simpletoolbar/
http://developers.arcgis.com/javascript/samples/ed_feature_creation/
- Mark as New
- Bookmark
- Subscribe
- Mute
- Subscribe to RSS Feed
- Permalink
Not sure how those samples were set up, but I found this issue to occur when deleting graphics using the clear function.
I have a graphics layer called drawingGraphicsLayer in which I set up an onClick event to activate the editor tool bar.
drawingGraphicsLayer.on("click", function (evt) {
dojo.stopEvent(evt);
editToolbar.activate(Edit.MOVE | Edit.SCALE | Edit.ROTATE | Edit.EDIT_VERTICES, evt.graphic);
});
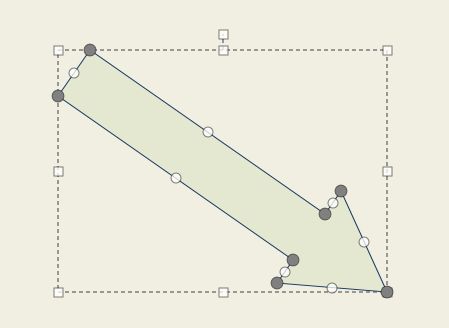
Here you can see I have drawn an arrow on the map and and activated the editor tool by clicking on the graphic.
I have a button to delete all graphics which invokes drawingGraphicsLayer.clear();
If that command is called while the editor tool is activated on the graphic the vertices remain on the screen.

I have found that adding the following onClick event on the map will remove the vertices by clicking elsewhere on the map.
map.on("click", function (evt) {
editToolbar.deactivate();
});
However, it seems like the editor tool should naturally be deactivated on all graphics if they are deleted using the clear function.
- Mark as New
- Bookmark
- Subscribe
- Mute
- Subscribe to RSS Feed
- Permalink
Kathleen,
I tend to disagree. It should be your responsibility as the developer to deactivate the edit tool before you use the GraphicLayers clear method since you are not using the edit tool to delete the feature.
- Mark as New
- Bookmark
- Subscribe
- Mute
- Subscribe to RSS Feed
- Permalink
How am I to use the edit tool to delete the graphic when there is no delete option on the edit tool?
According to the documentation, the edit tool only allows the following constants...
MOVE, SCALE, ROTATE, EDIT_VERTICES, and EDIT_TEXT
- Mark as New
- Bookmark
- Subscribe
- Mute
- Subscribe to RSS Feed
- Permalink
Kathleen,
If you look at the one sample this is how they are handling it:
layer.on("click", function(evt) {
  event.stop(evt);
  if (evt.ctrlKey === true || evt.metaKey === true) { //delete feature if ctrl key is depressed
  layer.applyEdits(null,null,[evt.graphic]);
  currentLayer = this;
  editToolbar.deactivate();
  editingEnabled=false;
  }
  });
But you could very simply just call editToolbar.deactivate() before you call GL.clear();
- Mark as New
- Bookmark
- Subscribe
- Mute
- Subscribe to RSS Feed
- Permalink
Kathleen,
So I created an app to show you specifically what I was telling you to do and I found that I could not reproduce what you are finding.
<!DOCTYPE html>
<html>

<head>
  <meta http-equiv="Content-Type" content="text/html; charset=utf-8">
  <meta name="viewport" content="width=device-width,user-scalable=no">

  <meta name="viewport" content="initial-scale=1, maximum-scale=1,user-scalable=no">
  <title>Maps Toolbar</title>

  <link rel="stylesheet" href="http://js.arcgis.com/3.15/dijit/themes/nihilo/nihilo.css">
  <link rel="stylesheet" href="http://js.arcgis.com/3.15/esri/css/esri.css">
  <style>
    html,
    body,
    #mainWindow {
      font-family: sans-serif;
      height: 100%;
      width: 100%;
    }

    html,
    body {
      margin: 0;
      padding: 0;
    }

    #header {
      height: 125px;
      overflow: auto;
      padding: 0.5em;
    }

    #mainWindow {
      visibility: hidden;
    }
  </style>

  <script src="http://js.arcgis.com/3.15/"></script>
  <script>
    var map, toolbar, symbol, geomTask, editToolbar;
    require([
            "esri/map",
            "esri/toolbars/draw",
            "esri/toolbars/edit",
            "esri/geometry/Point",
            "esri/geometry/Polyline",
            "esri/geometry/Polygon",
            "esri/graphic",
            "esri/symbols/SimpleMarkerSymbol",
            "esri/symbols/SimpleLineSymbol",
            "esri/symbols/SimpleFillSymbol",
            "esri/symbols/TextSymbol",
            "dojo/_base/event",
            "dojo/parser",
            "dojo/on",
            "dojo/dom-style",
            "dijit/registry",
            "dijit/Menu",
            "dijit/layout/BorderContainer", "dijit/layout/ContentPane",
            "dijit/form/Button", "dijit/form/ToggleButton",
            "dijit/form/DropDownButton", "dijit/CheckedMenuItem",
            "dojo/domReady!"
        ], function (
      Map,
      Draw, Edit, Point, Polyline, Polygon, Graphic,
      SimpleMarkerSymbol, SimpleLineSymbol, SimpleFillSymbol, TextSymbol,
      event, parser, on, domStyle, registry, Menu, BorderContainer, ContentPane, Button
    ) {
      parser.parse();

      map = new Map("map", {
        basemap: "topo", //if changed to "topo" the coordinates to centralize the map are used
        center: [176.264, -38.160],
        zoom: 5 //if the scion map is being used deep levels of the zoom wont work because the scion map doesnt have the tile
          //the map is centred at.
      });

      map.on("load", createToolbar);

      // loop through all dijits, connect onClick event
      // listeners for buttons to activate drawing tools
      registry.forEach(function(d) {
        // d is a reference to a dijit
        // could be a layout container or a button
        if ( d.declaredClass === "dijit.form.Button" ) {
          console.info(d);
          if(d.label === 'Clear'){
            d.on("click", ClearGL);
          }else{
            d.on("click", activateTool);
          }
        }
      });

      function ClearGL() {
        //editToolbar.deactivate();
        map.graphics.clear();
      }

      function activateTool() {
        var tool = this.label.toUpperCase().replace(/ /g, "_");
        toolbar.activate(Draw[tool]);
        map.hideZoomSlider();
      }

      function activateToolbar(graphic) { //activating the toolbars
        var tool = 0;
        if (registry.byId("tool_move").checked) {
          tool = tool | Edit.MOVE;
        }
        if (registry.byId("tool_vertices").checked) {
          tool = tool | Edit.EDIT_VERTICES;
        }
        if (registry.byId("tool_scale").checked) {
          tool = tool | Edit.SCALE;
        }
        if (registry.byId("tool_rotate").checked) {
          tool = tool | Edit.ROTATE;
        }

        // enable text editing if a graphic uses a text symbol
        if (graphic.symbol.declaredClass === "esri.symbol.TextSymbol") {
          tool = tool | Edit.EDIT_TEXT;
        }

        //specify toolbar options
        var options = {
          allowAddVertices: registry.byId("vtx_ca").checked,
          allowDeleteVertices: registry.byId("vtx_cd").checked,
          uniformScaling: registry.byId("uniform_scaling").checked
        };
        editToolbar.activate(tool, graphic, options);
      }

      function createToolbar(themap) { //creating the toolbars layout
        toolbar = new Draw(map);
        toolbar.on("draw-end", addToMap);
        editToolbar = new Edit(map);
        //Activate the toolbar when you click on a graphic
        map.graphics.on("click", function (evt) {
          event.stop(evt);
          activateToolbar(evt.graphic);
        });

        //deactivate the toolbar when you click outside a graphic
        map.on("click", function (evt) {
          editToolbar.deactivate();
        });
      }

      function addToMap(evt) { //adding shapes to the map
        var symbol;
        toolbar.deactivate();
        map.showZoomSlider();
        switch (evt.geometry.type) {
        case "point":
        case "multipoint":
          symbol = new SimpleMarkerSymbol();
          break;
        case "polyline":
          symbol = new SimpleLineSymbol();
          break;
        default:
          symbol = new SimpleFillSymbol();
          break;
        }
        var graphic = new Graphic(evt.geometry, symbol);
        map.graphics.add(graphic);
      }
      domStyle.set(registry.byId("mainWindow").domNode, "visibility", "visible");
    });
  </script>
</head>

<body class="nihilo">
  <div id="mainWindow" data-dojo-type="dijit/layout/BorderContainer" data-dojo-props="design:'headline'">
    <div id="header" data-dojo-type="dijit/layout/ContentPane" data-dojo-props="region:'top'">
      <span>Draw:<br /></span>
      <button data-dojo-type="dijit/form/Button">Point</button>
      <button data-dojo-type="dijit/form/Button">Multi Point</button>
      <button data-dojo-type="dijit/form/Button">Line</button>
      <button data-dojo-type="dijit/form/Button">Polyline</button>
      <button data-dojo-type="dijit/form/Button">Polygon</button>
      <button data-dojo-type="dijit/form/Button">Freehand Polyline</button>
      <button data-dojo-type="dijit/form/Button">Freehand Polygon</button>

      <button data-dojo-type="dijit/form/Button">Arrow</button>
      <button data-dojo-type="dijit/form/Button">Triangle</button>
      <button data-dojo-type="dijit/form/Button">Circle</button>
      <button data-dojo-type="dijit/form/Button">Ellipse</button>

      <button data-dojo-type="dijit/form/Button">Clear</button>
      <span>Specify options then click a graphic to edit the shape. Click outside the graphic to quit editing.</span>
      <br />
      <div id="tool_move" data-dojo-type="dijit/form/ToggleButton" data-dojo-props="checked:'true', iconClass:'dijitCheckBoxIcon'">Move</div>
      <div id="tool_vertices" data-dojo-type="dijit/form/ToggleButton" data-dojo-props="checked:'true', iconClass:'dijitCheckBoxIcon'">Edit Vertices</div>
      <div id="tool_scale" data-dojo-type="dijit/form/ToggleButton" data-dojo-props="checked:'true', iconClass:'dijitCheckBoxIcon'">Scale</div>
      <div id="tool_rotate" data-dojo-type="dijit/form/ToggleButton" data-dojo-props="checked:'true', iconClass:'dijitCheckBoxIcon'">Rotate</div>
      <button data-dojo-type="dijit/form/DropDownButton" id="options" data-dojo-props="value:'options'">
        <span>Options</span>
        <div data-dojo-type="dijit/Menu" id="optionsMenu">
          <div id="vtx_ca" data-dojo-type="dijit/CheckedMenuItem" data-dojo-props="checked:'true'">Allow Add Vertices</div>
          <div id="vtx_cd" data-dojo-type="dijit/CheckedMenuItem" data-dojo-props="checked:'true'">Allow Delete Vertices</div>
          <div id="uniform_scaling" data-dojo-type="dijit/CheckedMenuItem" data-dojo-props="checked:'true'">Uniform Scaling when Resizing</div>
        </div>
      </button>
    </div>
    <div id="map" data-dojo-type="dijit/layout/ContentPane" data-dojo-props="region:'center'"></div>
  </div>
</body>

</html>