- Home
- :
- All Communities
- :
- User Groups
- :
- Web AppBuilder Custom Widgets
- :
- Questions
- :
- Re: How to Build Percentage Bar Chart in Web AppBu...
- Subscribe to RSS Feed
- Mark Topic as New
- Mark Topic as Read
- Float this Topic for Current User
- Bookmark
- Subscribe
- Mute
- Printer Friendly Page
How to Build Percentage Bar Chart in Web AppBuilder
- Mark as New
- Bookmark
- Subscribe
- Mute
- Subscribe to RSS Feed
- Permalink
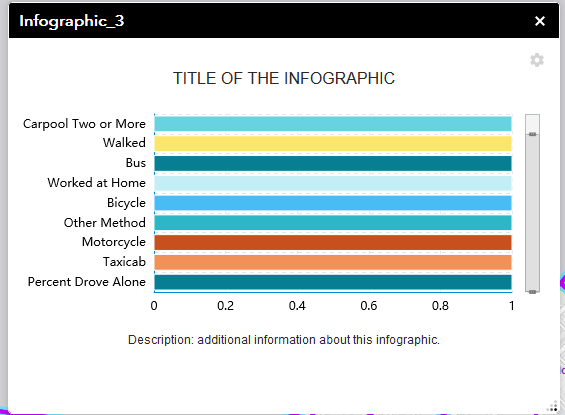
I was hoping to build a Bar Chart that displays percentages with one of the Infographics in the Web AppBuilder. I want a bar chart that displays the percentages on the fly like the pie chart does. I tried the Percentage Stacked Bar Chart, but all I get is bars where each display as 100%.
I feel like I'm missing a simple setting in the configuration. I would think there would be an option to indicate what categories to stack, or what field to use as a total for calculating percentages.
I want to avoid creating a new set of percentage fields in the tables.
Anyone else have success making a bar chart that displays percentages dynamically?

- Mark as New
- Bookmark
- Subscribe
- Mute
- Subscribe to RSS Feed
- Permalink
Hi Dan,
Are you using the Dojo library to create this? There are some good examples in their documentation -
https://dojotoolkit.org/documentation/tutorials/1.7/charting/
Also some samples at jsfiddle - Dojo Bar Chart Example - JSFiddle - Code Playground
Shay
- Mark as New
- Bookmark
- Subscribe
- Mute
- Subscribe to RSS Feed
- Permalink
Thanks for the reply. Unfortunately I'm limited to an out-of-the-box solution. Looking for away to configure it in the WebApp Builder.