- Home
- :
- All Communities
- :
- User Groups
- :
- Web AppBuilder Custom Widgets
- :
- Questions
- :
- Re: eDraw widget
- Subscribe to RSS Feed
- Mark Topic as New
- Mark Topic as Read
- Float this Topic for Current User
- Bookmark
- Subscribe
- Mute
- Printer Friendly Page
- Mark as New
- Bookmark
- Subscribe
- Mute
- Subscribe to RSS Feed
- Permalink
Ehanced draw widget for WebApp Builder for Arcgis
UPDATE 2018/05/09 (new Release v2.8.1) :
- refactoring
- use esri/geometry/projection (available since esri js api 3.24) instead of proj4js (external libs)
- systematic use of geometry engine (no more mercator utils, geometry server...)
- for polyline, the user can now add an arrow (available since esri js api 3.23)
- live measure while drawing
- WARNING : this release needs Esri API >= 3.24
(Direct zip link : https://github.com/magis-nc/esri-webappbuilder-widget-eDraw/releases/download/v2.8.1/eDraw.zip )
Demo : https://apps.magis.nc/demo/eDraw/
Github :
https://github.com/magis-nc/esri-webappbuilder-widget-eDraw
Wigdet's Features (improvments of standard Draw widget) :
- add name and description fields on drawings
- enable infowindow on drawings (selection)
- on text drawing, no insert if no name.
- on modification : enable geometry update (with snapping if wanted : CTRL) and preview symbology changes on the fly
- list
- add list of all drawings
- actions on each drawing : modify / delete / [up / down] / zoom
- all drawings : zoom, copy, delete, export
- on drawing infowindow -> select drawing in list
- on zoom on a drawing -> select drawing on map (and show infoWindow)
- re-order graphics with drag&drop
- import/export : allow users to export or import drawings (json format)
- import can be done with file drag&drop in import popup
- localStorage
- dynamic saving on each drawing add/delete/update
- on widget load : load drawings saved in local Storage
- draws plus (initially from Larry Stout https://geonet.esri.com/people/Larry_Stout)
- preview under mouse when adding text or point
- for text, add font choice, font angle, bold, italic, placement and underline options.
- add arrow menu for polyline
- checkbox to hide drawing's layer (and therefore widget UI)
- add of Nautical unit
- measure's for points/polylines/polygons with automatic update on element's update (or delete). Measure's can be indidualy disabled/enabled on any graphic.
- "On the fly" measure when drawing
- defaults symbols can be specified in config's file
- use of builtin projection engine (available since esri js api 3.24) instead of proj4js library
This message was updated by Jeremie Cornet (New Release)
GIS enthousiast, python & javascript lover
Solved! Go to Solution.
- Mark as New
- Bookmark
- Subscribe
- Mute
- Subscribe to RSS Feed
- Permalink
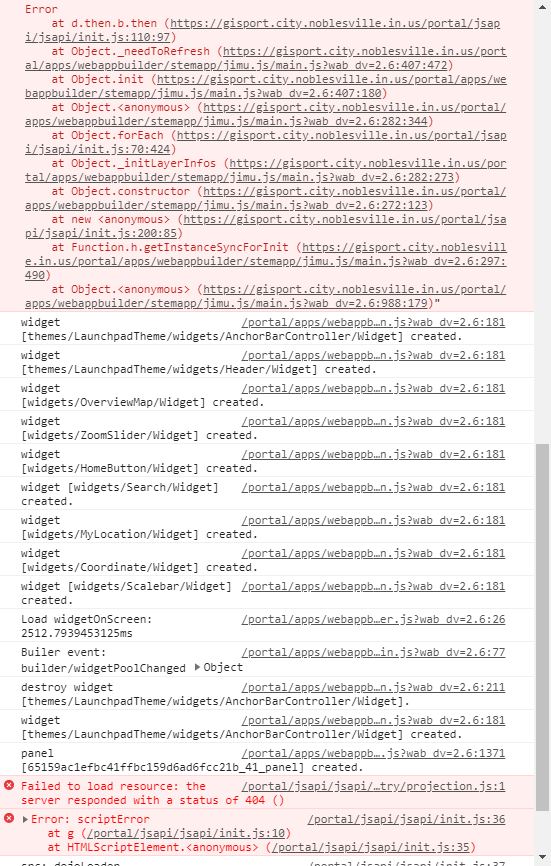
OK...seems like I'm late to the game, but glad I'm finally here. I downloaded your widget and it looks like it'll solve our users requests, but I can't seem to get it to load on my Portal (10.6)? I'm not very good at reading these types of errors so I'm hoping showing these will help finding out what's wrong.
- Mark as New
- Bookmark
- Subscribe
- Mute
- Subscribe to RSS Feed
- Permalink
Rick,
The error is about the projection class that was not added to the JS API until 3.24 which means Portal 10.6.1. You can not use this widget until you upgrade to 10.6.1.
- Mark as New
- Bookmark
- Subscribe
- Mute
- Subscribe to RSS Feed
- Permalink
well....that's a quick easy answer....I'll be sure to come back to this when we get up to 10.6.1 Thanks Robert
- Mark as New
- Bookmark
- Subscribe
- Mute
- Subscribe to RSS Feed
- Permalink
Or if you need it sooner you can build the app using WAB Dev outside of Portal and point to a newer version of the JS API.
- Mark as New
- Bookmark
- Subscribe
- Mute
- Subscribe to RSS Feed
- Permalink
I'm using the newest version of this widget (2.8.1) with WAB 2.10 but have noticed some odd behaviour around the edit window:
- After creating a new Point drawing, adding another will keep the symbology of the previous drawing selected but not update the symbol displayed in "Preview" which is still the default.
- Create several drawings (any type), select one to edit and hit the "Save" button in the edit menu. Select another drawing with the magnifying glass button. Close the widget right after (I have the widget in the WAB header and am closing it with "x") and the selected drawing will have its location and symbology reset to the other drawing that was saved. A single line in the code (line 2257 in widget.js) seems to be responsible for this.
Removing the line in the second point will fix that issue but I'm not sure how to go about fixing the first one.
- Mark as New
- Bookmark
- Subscribe
- Mute
- Subscribe to RSS Feed
- Permalink
I have all my vector layers in web mercator. WAB 2.10 with JS API 3.27 (set in env.js) and I am getting measurements that are like 25% too large. Is there a known measurement bug? SAGIS Property Map Viewer
- Mark as New
- Bookmark
- Subscribe
- Mute
- Subscribe to RSS Feed
- Permalink
I see the bug also on ArcGIS Web Application when comparing against parcels with known lengths of sides on the Esri basemap. 25 % too long. I am guessing some sort of GeometryEngine or JS API bug? I also see it on the demo MAGIC page.
- Mark as New
- Bookmark
- Subscribe
- Mute
- Subscribe to RSS Feed
- Permalink
Hi all,i have found the length/area issue.
My code switch between planar and geodesic mesure according of the projection used in the map.
I used the spatialReference wkid to detect if geodesic measure should apply. My code was testing if wkid is 4326 (WGS84 EPSG code) or 3857 (Mercator EPSG code) but the wkid for mercator in esri Api is 102100 !
-> the planar method was used by the widget for mercator maps...
The correction :
GIS enthousiast, python & javascript lover
- Mark as New
- Bookmark
- Subscribe
- Mute
- Subscribe to RSS Feed
- Permalink
Jeremie Cornet thank you! I downloaded the new widget.js to try. I grabbed the file off Git and swapped it for my existing widget.js. It didn't display any measurements, for any shape. I redownloaded the whole Git repo, same. Console says Uncaught TypeError: Cannot read property 'MeasureSymbol' of undefined at Object._getTxtGraphic (Widget.js?wab_dv=2.9:1828) at Object.addMeasure (Widget.js?wab_dv=2.9:1875) .... However I think there is just some minor syntax with the widget.js file on Git.
I manually put in your additions and subtractions changes, in to my widget.js. Now it works perfect!!! Thanks Jeremie, we all love this widget and I use it in all our viewers.