- Home
- :
- All Communities
- :
- User Groups
- :
- Web AppBuilder Custom Widgets
- :
- Questions
- :
- Re: Change legend title, name and label of a laye...
- Subscribe to RSS Feed
- Mark Topic as New
- Mark Topic as Read
- Float this Topic for Current User
- Bookmark
- Subscribe
- Mute
- Printer Friendly Page
Change legend title, name and label of a layer
- Mark as New
- Bookmark
- Subscribe
- Mute
- Subscribe to RSS Feed
- Permalink
I am adding an ArcGISDynamicMapServiceLayer layer on run time in to a Web appbuilder application. So far I am able to manipulate/change the title and name of the layer on the legend widget but not the labels (marked in black)

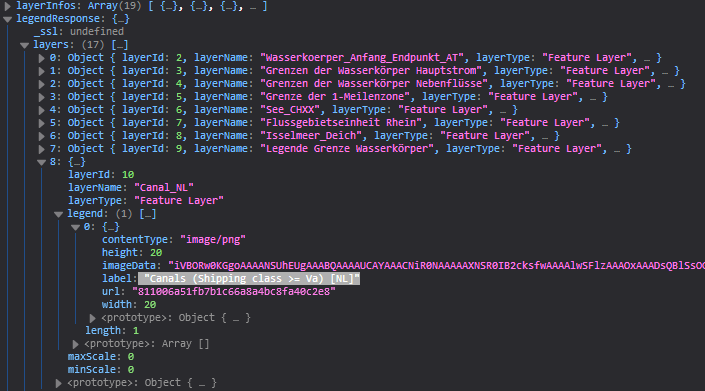
If you log the layerInfoParam.layer you can clearly see that the label is part of the legendResponse object (line 151), but trying to access this object results in to "undefined". Any idea why?
The alternative to use esriRequest and fetch the legend object in json looks not a lightweight task so not an good option.
console.log(layerInfoParam.layer){…}
__coords_dx: 0
__coords_dy: 0
_active: <div style="position: absolute; width: 1136px; height: 333px; overflow: visible; transition: transform 500ms ease 0s;">
_addImage: function hitch()
_attrs: Object { "data-suspended": "", "data-hidden": "" }
_cleanUpRemovedImages: function hitch()
_ct: null
_defaultVisibleLayers: Array(15) [ 0, 1, 2, … ]
_displayLevels: undefined
_div: <div id="map_Topografie und Bodenbedeckung" style="position: absolute; width: 1136px; height: 333px; overflow: visible; transform: translate3d(0px, 0px, 0px); display: none;" data-suspended="" data-hidden="">
_errorHandler: function hitch()
_exclusionsPerZoom: null
_fireOnUpdate: false
_fireOnUpdateEvent: function hitch()
_hasMax: true
_hasMin: true
_hideDefaultSymbol: false
_infoTemplates: null
_inherited: Object { c: (), p: 3 }
_initLayer: function hitch()
_isRefLayer: false
_load: function hitch()
_loadCallback: undefined
_loadingList: null
_lowestLevel: 0
_lyrZEHandle: Object { remove: remove(), id: 11, receiveArguments: true, … }
_map: Object { _plugins: {…}, _internalLayerIds: (1) […], _layerSize: 6, … }
_multiple: 1
_noDom: 0
_onExtentChangeHandler_connect: null
_onPanHandler_connect: null
_onPanStartHandler_connect: null
_Handler_connect: Object { remove: remove(), id: 8, receiveArguments: true, … }
_onScaleHandler_connect: null
_onZoomHandler_connect: null
_onZoomStartHandler_connect: null
_opacityChangeHandler_connect: Object { remove: remove(), id: 0, receiveArguments: true, … }
_params: Object { }
_passives: Array []
_patchIE: false
_popTile: function hitch()
_removeList: null
_resamplingTolerance: undefined
_resumedOnce: true
_rrIndex: 0
_standby: null
_tileBounds: null
_tileErrorHandler: function hitch()
_tileH: 256
_tileIds: null
_tileLoadHandler: function hitch()
_tileMapCallback: function hitch()
_tileW: 256
_tiles: null
_titleForLegend: "Topografie und Bodenbedeckung"
_transitionEnd: function hitch()
_url: Object { path: "https://geoportal.bafg.de/arcgis3/rest/services/IKSR_WRRL_2015/k1_2000_de/MapServer", query: null }
_wakeTimer: null
_wrap: true
attributionDataUrl: ""
capabilities: "Map,Query,Data"
className: undefined
copyright: ""
credential: undefined
description: ""
exclusionAreas: undefined
fullExtent: Object { type: "extent", xmin: 389280.3733725788, ymin: 5822598.578892125, … }
hasAttributionData: false
id: "Topografie und Bodenbedeckung"
infoTemplates: null
initialExtent: Object { type: "extent", xmin: 389280.37337257876, ymin: 6256939.447573861, … }
isPNG32: false
isResampling: false
layerInfos: Array(15) [ {…}, {…}, {…}, … ]
legendResponse: Object { layers: (13) […], _ssl: undefined }
loaded: true
maxImageHeight: 4096
maxImageWidth: 4096
maxRecordCount: 1000
maxScale: 1128.497176
minScale: 591657527.591555
normalization: true
onFeatureReducti: function c()
onFeatureReductionRendererChange: function c()
"token punctuation">: function c()
onOpacityChange: function c()
onScaleRangeChange: function c()
onVisibilityChange: function c()
"onvisible-layers-change": function c()
refresh: function hitch()
refreshInterval: 0
resampling: false
resourceInfo: "{\"currentVersion\":10.51,\"serviceDescription\":\"\",\"mapName\":\"Layers\",\"description\":\"\",\"copyrightText\":\"\",\"supportsDynamicLayers\":true,\"layers\":[{\"id\":0,\"name\":\"rwseg_2000_anno_karte\",\"parentLayerId\":-1,\"defaultVisibility\":true,\"subLayerIds\":[],\"minScale\":0,\"maxScale\":0},{\"id\":1,\"name\":\"cities_2000_anno\",\"parentLayerId\":-1,\"defaultVisibility\":true,\"subLayerIds\":[],\"minScale\":0,\"maxScale\":0},{\"id\":2,\"name\":\"Rwseg_DATEN\",\"parentLayerId\":-1,\"defaultVisibility\":true,\"subLayerIds\":null,\"minScale\":0,\"maxScale\":0},{\"id\":3,\"name\":\"Grenze der 1-Meilenzone\",\"parentLayerId\":-1,\"defaultVisibility\":true,\"subLayerIds\":null,\"minScale\":0,\"maxScale\":0},{\"id\":4,\"name\":\"Isselmeer_Deich\",\"parentLayerId\":-1,\"defaultVisibility\":true,\"subLayerIds\":null,\"minScale\":0,\"maxScale\":0},{\"id\":5,\"name\":\"See_CHXX\",\"parentLayerId\":-1,\"defaultVisibility\":true,\"subLayerIds\":null,\"minScale\":0,\"maxScale\":0},{\"id\":6,\"name\":\"Flussgebietseinheit Rhein\",\"parentLayerId\":-1,\"defaultVisibility\":true,\"subLayerIds\":null,\"minScale\":0,\"maxScale\":0},{\"id\":7,\"name\":\"Uebergangsgewaesser_K1\",\"parentLayerId\":-1,\"defaultVisibility\":true,\"subLayerIds\":null,\"minScale\":0,\"maxScale\":0},{\"id\":8,\"name\":\"rwseg_Legende\",\"parentLayerId\":-1,\"defaultVisibility\":true,\"subLayerIds\":null,\"minScale\":0,\"maxScale\":0},{\"id\":9,\"name\":\"rwseg_chxx\",\"parentLayerId\":-1,\"defaultVisibility\":true,\"subLayerIds\":null,\"minScale\":0,\"maxScale\":0},{\"id\":10,\"name\":\"Kanal m Wesel Datteln Kanal\",\"parentLayerId\":-1,\"defaultVisibility\":true,\"subLayerIds\":null,\"minScale\":0,\"maxScale\":0},{\"id\":11,\"name\":\"Kanal\",\"parentLayerId\":-1,\"defaultVisibility\":true,\"subLayerIds\":null,\"minScale\":0,\"maxScale\":0},{\"id\":12,\"name\":\"Canal_NL\",\"parentLayerId\":-1,\"defaultVisibility\":true,\"subLayerIds\":null,\"minScale\":0,\"maxScale\":0},{\"id\":13,\"name\":\"Corine Land Cover 2006\",\"parentLayerId\":-1,\"defaultVisibility\":true,\"subLayerIds\":null,\"minScale\":0,\"maxScale\":0},{\"id\":14,\"name\":\"gtopo30_hil\",\"parentLayerId\":-1,\"defaultVisibility\":true,\"subLayerIds\":null,\"minScale\":0,\"maxScale\":0}],\"tables\":[],\"spatialReference\":{\"wkid\":102100,\"latestWkid\":3857},\"singleFusedMapCache\":true,\"tileInfo\":{\"rows\":256,\"cols\":256,\"dpi\":96,\"format\":\"PNG\",\"compressionQuality\":0,\"origin\":{\"x\":-20037508.342787,\"y\":20037508.342787},\"spatialReference\":{\"wkid\":102100,\"latestWkid\":3857},\"lods\":[{\"level\":0,\"resolution\":156543.03392800014,\"scale\":591657527.591555},{\"level\":1,\"resolution\":78271.51696399994,\"scale\":295828763.795777},{\"level\":2,\"resolution\":39135.75848200009,\"scale\":147914381.897889},{\"level\":3,\"resolution\":19567.87924099992,\"scale\":73957190.948944},{\"level\":4,\"resolution\":9783.93962049996,\"scale\":36978595.474472},{\"level\":5,\"resolution\":4891.96981024998,\"scale\":18489297.737236},{\"level\":6,\"resolution\":2445.98490512499,\"scale\":9244648.868618},{\"level\":7,\"resolution\":1222.992452562495,\"scale\":4622324.434309},{\"level\":8,\"resolution\":611.4962262813797,\"scale\":2311162.217155},{\"level\":9,\"resolution\":305.74811314055756,\"scale\":1155581.108577},{\"level\":10,\"resolution\":152.87405657041106,\"scale\":577790.554289},{\"level\":11,\"resolution\":76.43702828507324,\"scale\":288895.277144},{\"level\":12,\"resolution\":38.21851414253662,\"scale\":144447.638572},{\"level\":13,\"resolution\":19.10925707126831,\"scale\":72223.819286},{\"level\":14,\"resolution\":9.554628535634155,\"scale\":36111.909643},{\"level\":15,\"resolution\":4.77731426794937,\"scale\":18055.954822},{\"level\":16,\"resolution\":2.388657133974685,\"scale\":9027.977411},{\"level\":17,\"resolution\":1.1943285668550503,\"scale\":4513.988705},{\"level\":18,\"resolution\":0.5971642835598172,\"scale\":2256.994353},{\"level\":19,\"resolution\":0.29858214164761665,\"scale\":1128.497176}]},\"initialExtent\":{\"xmin\":389280.37337257876,\"ymin\":6256939.447573861,\"xmax\":1330828.506468845,\"ymax\":7122763.679222325,\"spatialReference\":{\"wkid\":102100,\"latestWkid\":3857}},\"fullExtent\":{\"xmin\":389280.3733725788,\"ymin\":5822598.578892125,\"xmax\":1330828.5064688448,\"ymax\":7122763.679222326,\"spatialReference\":{\"wkid\":102100,\"latestWkid\":3857}},\"minScale\":591657527.591555,\"maxScale\":1128.497176,\"units\":\"esriMeters\",\"supportedImageFormatTypes\":\"PNG32,PNG24,PNG,JPG,DIB,TIFF,EMF,PS,PDF,GIF,SVG,SVGZ,BMP\",\"documentInfo\":{\"Title\":\"compath_2000_de.mxd\",\"Author\":\"\",\"Comments\":\"\",\"Subject\":\"\",\"Category\":\"\",\"AntialiasingMode\":\"None\",\"TextAntialiasingMode\":\"Force\",\"Keywords\":\"\"},\"capabilities\":\"Map,Query,Data\",\"supportedQueryFormats\":\"JSON, AMF, geoJSON\",\"exportTilesAllowed\":false,\"supportsDatumTransformation\":true,\"maxRecordCount\":1000,\"maxImageHeight\":4096,\"maxImageWidth\":4096,\"supportedExtensions\":\"WMSServer\"}"
scales: Array(20) [ 591657527.591555, 295828763.795777, 147914381.897889, … ]
setDefinitionExpression: function c()
setInfoTemplates: function c()
setLayerDefinitions: function c()
setRenderer: function c()
spatialReference: Object { wkid: 102100, latestWkid: 3857 }
supportsDynamicLayers: true
suspended: true
tileInfo: Object { rows: 256, cols: 256, dpi: 96, … }
units: "esriMeters"
updating: false
url: "https://xxxx/xxx/rest/services/xxx/xxx/MapServer"
version: 10.51
visible: false
visibleAtMapScale: true
visibleLayers: Array(15) [ 0, 1, 2, … ]
<prototype>: Object { declaredClass: "esri.layers.ArcGISTiledMapServiceLayer", _agolAttrs: (14) […], _isReference: false, … }Any hint would be appreciated !!
Mehretab
Solved! Go to Solution.
Accepted Solutions
- Mark as New
- Bookmark
- Subscribe
- Mute
- Subscribe to RSS Feed
- Permalink
Sounds like a timing issue then as the legendResponse has not be defined yet.
- Mark as New
- Bookmark
- Subscribe
- Mute
- Subscribe to RSS Feed
- Permalink
How are you trying to access the legendresponce n your code?
- Mark as New
- Bookmark
- Subscribe
- Mute
- Subscribe to RSS Feed
- Permalink
Hi Robert,
layerInfoParam.layer.legendResponse;
layerInfoParam.title="This is the title";
layerInfoParam.layer.layerInfos[3].name ="This is the name";The full code:
_getLayerInfosParam: function() {
var layerInfosParam;
if(this.config.legend.layerInfos === undefined) {
// widget has not been configed.
layerInfosParam = legendUtils.getLayerInfosParam();
} else {
// widget has been configed, respect config.
layerInfosParam = legendUtils.getLayerInfosParamByConfig(this.config.legend);
}
filteredLayerInfosParam = layerInfosParam.filter(function(layerInfoParam) {
console.log(layerInfoParam.layer)
if(layerInfoParam.title === "Topografie und Bodenbedeckung"){
layerInfoParam.hideLayers=[0,1,2,5,6,7,8,9,10,11,12,13,14,15,16,17,18]; //01234
//THE WAY I TRIED TO ACCESS THE legendResponse OBJECT
layerInfoParam.layer.legendResponse;
layerInfoParam.title="This is the title"
layerInfoParam.layer.layerInfos[3].name ="This is the name";
return layerInfoParam;
}
});
return filteredLayerInfosParam;
},Thanks!
- Mark as New
- Bookmark
- Subscribe
- Mute
- Subscribe to RSS Feed
- Permalink
Sounds like a timing issue then as the legendResponse has not be defined yet.
- Mark as New
- Bookmark
- Subscribe
- Mute
- Subscribe to RSS Feed
- Permalink
Hallo Robert I am back.
Some thing caught my attention on the result of:
console.log(layerInfoParam.layer)In Firefox it logs the legendResponse and all the property under it as you can see below, and I can see the legend label but cant access it in my script.
But the same console.log(layerInfoParam.layer); doesn't log the legendResponse object in Internet Explorer.
the _getLayerInfosParam() functions posted above is instantiated inside the onOpen function, if encase it is something to do with "timing issue" as you suggested.
onOpen: function() {
this._jimuLayerInfos = LayerInfos.getInstanceSync();
var legendParams = {
arrangement: this.config.legend.arrangement,
autoUpdate: this.config.legend.autoUpdate,
respectCurrentMapScale: this.config.legend.respectCurrentMapScale,
map: this.map,
layerInfos: this._getLayerInfosParam()//HERE IT IS
};
this.legend = new Legend(legendParams, html.create("div", {}, this.domNode));
this.legend.startup();
this._bindEvent();
},
Thanks.
- Mark as New
- Bookmark
- Subscribe
- Mute
- Subscribe to RSS Feed
- Permalink
Methtretab,
Try using a setTimeout in your method.
_getLayerInfosParam: function() {
var layerInfosParam;
if(this.config.legend.layerInfos === undefined) {
// widget has not been configed.
layerInfosParam = legendUtils.getLayerInfosParam();
} else {
// widget has been configed, respect config.
layerInfosParam = legendUtils.getLayerInfosParamByConfig(this.config.legend);
}
setTimeout(lang.hitch(this, function(){
filteredLayerInfosParam = layerInfosParam.filter(function(layerInfoParam) {
console.log(layerInfoParam.layer)
if(layerInfoParam.title === "Topografie und Bodenbedeckung"){
layerInfoParam.hideLayers=[0,1,2,5,6,7,8,9,10,11,12,13,14,15,16,17,18]; //01234
//THE WAY I TRIED TO ACCESS THE legendResponse OBJECT
//You don't seem to be assigning this to a var ot logging it to the console
//so your line below is doing nothing
//layerInfoParam.layer.legendResponse;
layerInfoParam.title="This is the title"
layerInfoParam.layer.layerInfos[3].name ="This is the name";
return layerInfoParam;
}
});
return filteredLayerInfosParam;
}), 500);
},- Mark as New
- Bookmark
- Subscribe
- Mute
- Subscribe to RSS Feed
- Permalink
The layerInfoParam.layer.legendResponse is a promise and it clearly seems the return layerInfoParam statement was processed before the promise was resolved. Any way I made a request and fetch the legend object and manipulated the response. Here is the working code:
_getLayerInfosParam: function() {
var layerInfosParam;
var nls =this.nls
if(this.config.legend.layerInfos === undefined) {
// widget has not been configed.
layerInfosParam = legendUtils.getLayerInfosParam();
} else {
// widget has been configed, respect config.
layerInfosParam = legendUtils.getLayerInfosParamByConfig(this.config.legend);
}
filteredLayerInfosParam = layerInfosParam.filter(function(layerInfoParam) {
console.log(layerInfoParam);
if(layerInfoParam.title ==="Oberflächengewässer - Lage und Grenzen der Wasserkörper"){
layerInfoParam.hideLayers=[0,1,2,5,6,7,8,9,10,11,12,13,14,15,16,17,18];
layerInfoParam.title="The legend title";
layerInfoParam.layer.layerInfos[3].name="Layer name";
//HERE REQUES IS MADE TO FETCH THE LEGEND OBJECT
if (layerInfoParam.layer.legendResponse===undefined){
//legendResponsRequest IS MADE A GOLOBAL VARIABLE TO AVOID MULTIPLE REQUEST ON OPEN AND CLOSE OF LEGEND WIDGET
legendResponsRequest.then(function(response) {
// console.log(response.layers);
layerInfoParam.layer.legendResponse=response;
//WE CAN THEN MANIPULATE THE LABEL AND OTHER PROPERTIES IN THE layerInfoParam.layer.legendResponse
layerInfoParam.layer.legendResponse.layers[2].legend[0].label="layer label";
//console.log(layerInfoParam.layer.legendResponse);
return layerInfoParam.layer.legendResponse;
});
}
return layerInfoParam;
}
});
return filteredLayerInfosParam;
},But I am still looking for a means to access the legendResponse without making a request. Is it possible to make the script to wait till the legendResponse is resolved?
- Mark as New
- Bookmark
- Subscribe
- Mute
- Subscribe to RSS Feed
- Permalink
Not that I am aware of.
- Mark as New
- Bookmark
- Subscribe
- Mute
- Subscribe to RSS Feed
- Permalink
The setTimeout certainly helped to wait till layerInfoParam.layer.legendResponse is resolved hence
console.log(layerInfoParam.layer.legendResponse) statement is no more undefined, it is logging the appropriate information.
But an attempt to change any properties under the legendResponse object do not appear to have an effect. Forexample:
layerInfoParam.layer.legendResponse.layers[2].legend[0].label="layer label";The reason seems still to be the timing issue. If you check off (hide) the layer in layer list widget and then check it on again the changes are taking effect.
It seems the delay caused by the setTimeout, is making the legend widget to take the defualt value for layerInfos object, which is all layers in the map be displayed in the legend.
Thanks again
- Mark as New
- Bookmark
- Subscribe
- Mute
- Subscribe to RSS Feed
- Permalink
The whole Idea of changing the Title, name and legend item's label of a layer in the legend Widget was to have different text depending on your locale (nls based strings). By manipulating the text in client side, it saved us from publishing the same service in different languages multiple times.
This application will change the language of the text on the Layer List Widget and Legend Widget base on your locale (en, de, fr and nl us of now).
The question is can we imitate this to the printer's legend item (in print layout ). It seems the printer widget is not flexible - at list from the documentation to handle such process. Any Idea how to manipulate/change the legend Item text in the print layout from the client side.
Thanks!