- Home
- :
- All Communities
- :
- User Groups
- :
- Web AppBuilder Custom Widgets
- :
- Documents
- :
- Measure Widget 2.15 for Web App Builder
- Subscribe to RSS Feed
- Mark as New
- Mark as Read
- Bookmark
- Subscribe
- Printer Friendly Page
Measure Widget 2.15 for Web App Builder
Measure Widget 2.15 for Web App Builder
Latest update:
02/11/2020 - fixed a change in the API that altered the way points were counted in path polylines and ring polygons. Thanks Robert Scheitlin!
- also updated css to fix issue with trash can icon. Thank you Robert!
- updated the editing as the event handlers had also changed in the API. TODO: found esri bug on edit toolbar that creates a ghost vertex as the last vertex. This creates issues when editing a polyline or polygon.05/04/2017 - added functionality to display an interactive polyline total when drawing two or more segments.
03/30/2017 - tested with WAB 2.4. Fixed bug with editing measures.
08/19/2016 - added logic to calculate bearing for each segment for polyline and polygon geometries. Minor bug fixes and tested with WAB 2.1.
02/16/2016 - updated logic to use the abbreviation on measurement labels.
02/12/2016 - added checkbox to display summary measurement labels. Fixed problem that was leaving a 0.0 measurement when finishing a line.
12/16/2015 - verified widget to work with WAB 1.3 and added nautical miles to the dropdown list for distances
10/13/2015 - added help page and editing for some geometry types (line, polyline and polygon)
09/30/2015 - updated to remove unnecessary logic for IE - NIM094815: The mouse-drag event now works correctly using IE10 and IE11.
09/29/2015 - updated the widget to use better calculations for area and length, especially for basemaps using a projected coordinate system
09/09/2015 - upgrade to new release of WAB 1.2
fixed problem with CSS that was corrupting apps at 1.2
04/06/2015 - upgrade to new release of WAB 1.1
use new JSAPI scaleUtils to get map units
added logic for Internet Explorer to measure all geometry types
updated offset for mobile on certain geometry types
03/04/2015 - stacked area measurements
added logic for calculating map units
added ability to change measure text size and color
02/24/2015 - added logic for using on iPad, iPhone and Android devices
added logic for stopping popups
02/18/2015 - removed the last measure from the freehand polygon tool
02/17/2015 - fix problem with perimeter measurement
02/17/2015 - Initial release created from the draw widget.
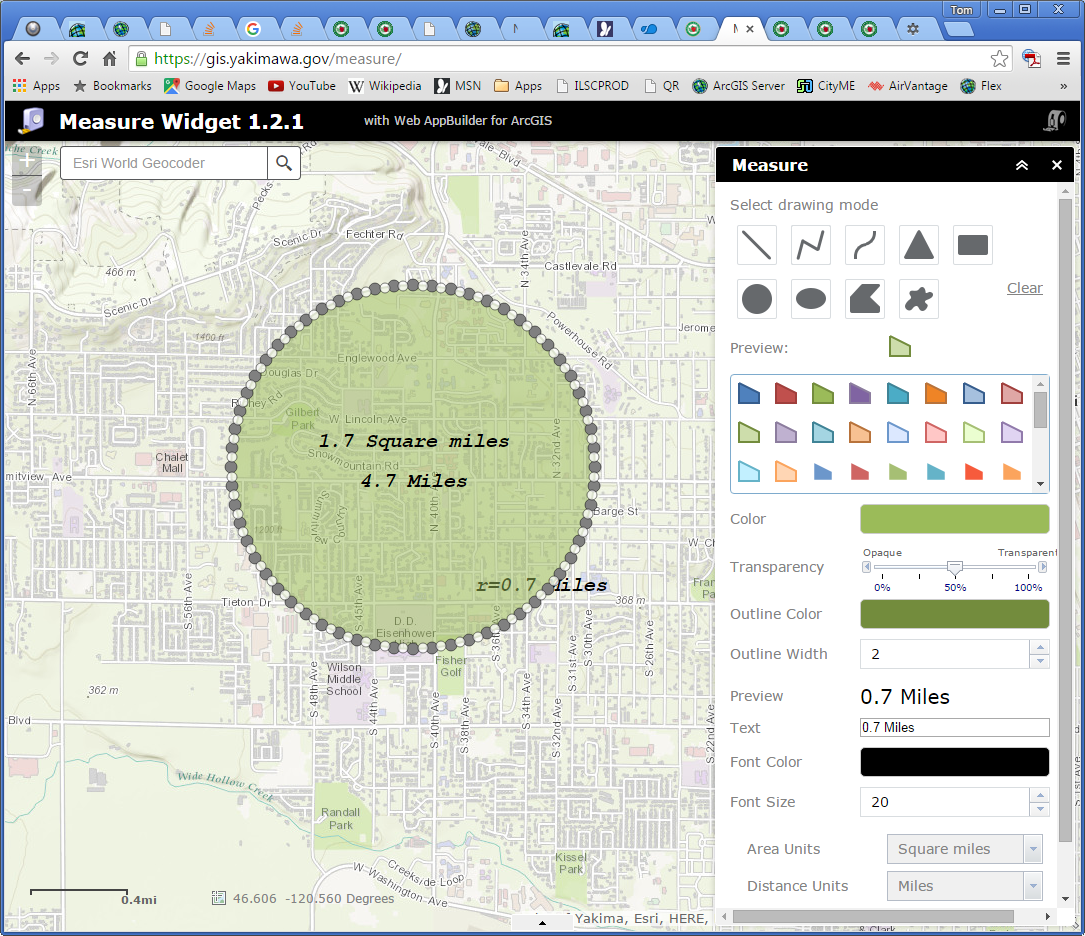
The example above will demonstrate the measure widget. A feature layer has been added to the map so you can also see how snapping works. You can hold the CTRL key when measuring a feature and it will snap to the closest nodes.
Logic has been added to allow the widget to be used on mobile devices. It has been tested on an iPad and iPhone. An Android device was not available for testing. Polygon and polyline measures just use tap locations to provide segment measurements. All other measures are more interactive on mobile devices.
The measure widget for WAB is my first attempt at converting the widget I had creating for the FlexViewer into the WAB context. It gives interactive measures for segments and drawn elements as they are being drawn. This widget is derived from the draw widget. This was very useful for the folks in our planning department, which is what made me create the widget originally.
There are new measures for some of the other draw types. I am not sure that all of them will be as useful as the measures for the polygon and polyline measures.
The widget now allows editing for some geometry times. Lines, polylines and polygons are now editable. You can click on a drawn measure graphic and put it in edit mode. Drag the vertex points to new locations and the widget will interactively update the measurements. You can also change the color, fill color, line type, text color and text size of a graphic in edit mode. Note: Does not work on IE or iOS. The edit function turns off mouse events on IE and iOS, so there is no way to track the measurement.
Regards,
Tom
I guess I was looking in the wrong place. Thanks Tom.
David,
You are welcome! You could probably add some javascript to accomplish this too, but modifying the HTML is the simple way to do it.
Best Regards,
Tom
Tom Sellsted ... I got an interesting challenge for ya!
Bearing. How many folks here would find it useful to be able to draw a line and it label the bearing on it?
Someone asked me that today interestingly enough in ArcMap. I remember researching this a few years ago and being similarly surprised to find out there was no way to do it in ArcMap. At least out of the box. It should just be a simple option to display on lines in the Measure tool in ArcMap. Apparently it's calculated under the hood and you can get it with various ways, but it is not there out of the box. I was not the only one with this question.
How do I get compass bearing for a line segment 2004 (thread referred to)
Quick measure distance and bearing (tool) 2011
Direction (bearing) of a line? 2015
It would be a great addition for ArcMap 10.4, JavaScript API 4.0 Measure Widget and/or WebApp Builder 2.0.
In the meantime.. And I know it might be a big ask or not possible through API but what do you think Tom Sellsted? Are projections and coordinate systems a factor?
Kevin,
I am calculating an angle to place the text along the line. I am not sure that this would be considered a true bearing though. I can experiment with it and maybe have a sample for you to look at. How would you like the measurement and bearing presented?
Regards,
Tom
Decimal Degrees. Number of decimals would probably be something the be settable in the widget Config ideally but at least as a first cut, you could just have it changeable in the widget code (kind of like how the decimals for ESRI's built in Coordinate widget aren't exposed in Config but you can just go into the widget's code to change it)
Tom you're awesome. Are you going to the Dev Conference? Anyone else?
Hi Tom,
Your widget is what I was looking for!
Do you think it is possible to add the option to save the drawings to a layer? or to use the same functionability on editing fearturs?
Dikla.
Great work Tom! Thanks for your work.
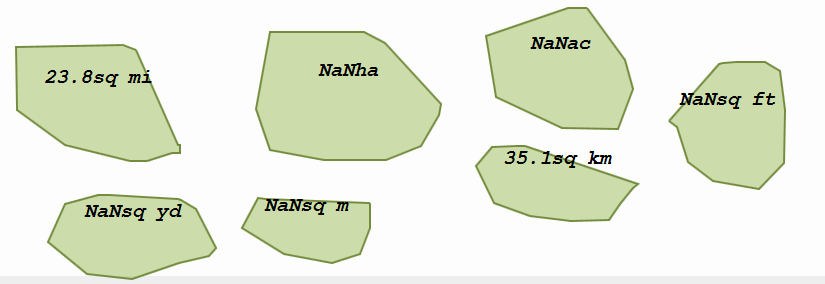
Just a little bug here to report. When zoom out to about 1:400,000 the polygon returns the Measurement Totals as NaN for some of the area units.
Picture are attached with hand free drawings.
Tom,
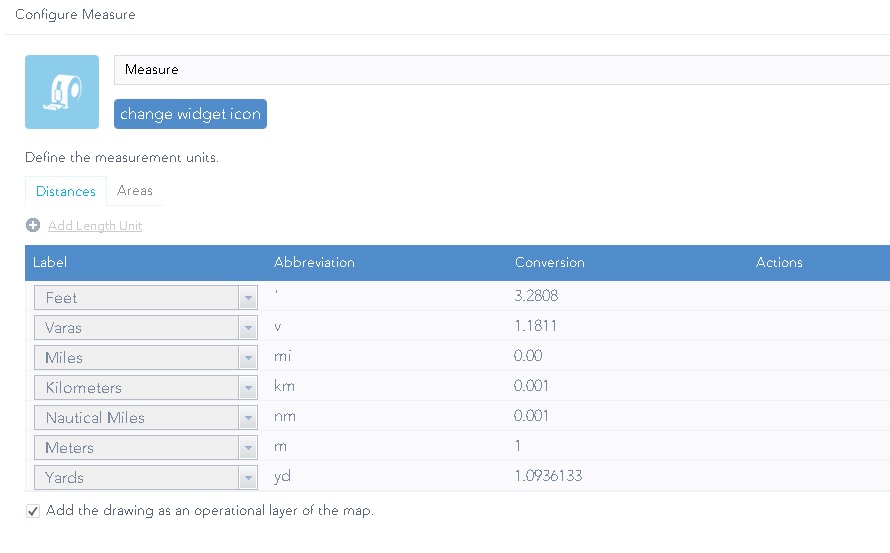
Thank you for the great widget! I need to add the measurement of "Varas" to the tool. I went into the Settings.js file and added the measurement
{
value: 'VARAS',
label: this.nls.varas,
abbr: this.nls.varasAbbreviation || 'v',
conversion: jimuUtils.localizeNumber(1.1811, {
places: 4
})
}
I added the units info to the nls folders and this to the widgets.js file
{
unit: 'VARAS',
label: this.nls.varas
}
When I open the widget in WAB I can add the unit in the configuration of the widget and see the "Varas" with the appropriate length. But when I launch the widget, I don't see Varas as an option to measure with.
Can you please assist me in on how to add my new unit of measurement of Varas to the selection screen?
Alex,
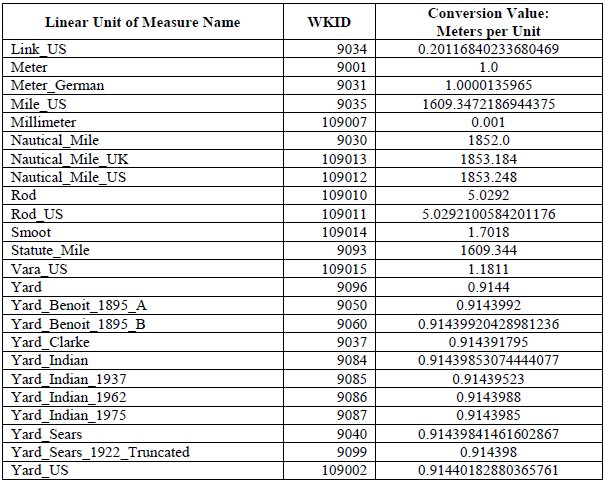
Apologies, but measurements in varas are not possible. I make use of the JSAPI's geometryEngine to do measurement calculations. It uses the unit constants in the following lists for the calculations. Varas are not one of the available constants.
ArcObjects Help for .NET developers
or
ArcObjects Help for .NET developers
Regards,
Tom
Nice Widget,
Im wondering how i can remove certain panels off it? like the colour panel and line selection panel
Thanks,
Gerard
Thank you Tom, that is what I figured, I just wanted to make sure there wasn't something I was missing. I appreciate the great widget!
Great Widget!! anything in the works to be able to add a bearing as you draw?
Scott,
I have looked into adding a bearing to the measurement, but the math required is a bit beyond my abilities. I use the geometryEngine module to calculate distances for planar and geodesic geometries. In a geodesic context there is a initial bearing and final bearing, which adds a bit more complexity to what would be displayed. It would be ideal if the geometryEngine had a method for calculating a geodesicBearing and a planarBearing, but those methods don't exist. Maybe I should post an idea to the js geonet and see if that is possibility.
Regards,
Tom
Greetings Measure Widget Users!
I have created an idea for adding bearing methods to the geometryEngine module. This will greatly assist in my ability to add bearings to the measurements. If you could, please vote up this suggestion to get it considered for addition. You can find it at:
https://community.esri.com/ideas/12437
Thanks very much!
Tom
Greetings all measure widget users!
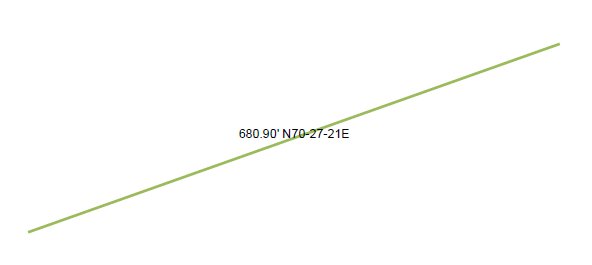
I have added functionality to the measure widget that will now allow you to show bearings for each drawn segment for polyline and polygon geometries. Thanks very much to Dean Anderson from Polk County, OR for the code snippet that allowed me to get this working. You can also edit the polyline or polygon graphic and the bearings will change accordingly.
Regards,
Tom
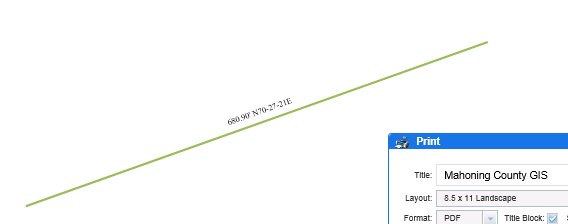
I am having a print issue using the Measure Widget 2.1. When a print is created the angle of the dimensions always appears 90degrees and not at the angle of the line or measurement. Ideas/fixes?
Rich
I'm seeing ok bearings here, on WAB 2.11 (in reply to RichBell's post). Using regular polyline.
Tom, this is great! Really fantastic work & thank you.
I'm excited to show our users your new version.
Hi Tom,
Lovely Widget you have created, thanks for sharing it. Please I have a question on the editing (Changing color and modifying vertices) of the graphics are not enabled for "freehand (both polyline and polygon), Circle, Square or Triangle", is this a bug or how the widget has been coded?
Thanks
Baba
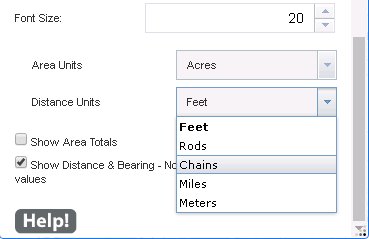
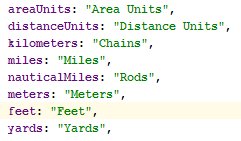
I found a way to "fool" the units. I needed Chains and Rods as a unit. I changed the WKID values for Nautical Miles to the values of Rods and changed the values of Kilometers to the values of Chains, then I changed the nls to reflect this.
See attached images. Hope this may help in the short term!
Good Luck!
Rich
Rich,
The printing has been a problem. I don't have any control of how the printing process moves and changes the text. There is a screenshot widget https://community.esri.com/people/kmsagis/blog/2015/06/09/kevins-custom-wab-widgets that has been used to create usable images with the text in place. You might be able to try that and see if you get a better result.
Regards,
Tom
Babatope,
This was intentional. Those geometries are really complex and would be difficult to restrict the type of change made to them. Recalculating measurements would not work well. Here is an example:
Regards,
Tom
Hi Tom
First of all, great widget! Thanks for releasing this.
I do however have a question, how could I modify perhaps the JS code so that when for example measuring a polygon that it would maybe also give the coords of each point clicked?
Thanks,
Brett
Brett,
Thanks very much!
Adding coordinates is probably doable, but will add another level of complexity. This is compounded even more when editing a measurement. It will also make the display very busy. The vertex coordinates would also have to be in same coordinate system as the basemap unless you added logic to project them. All of the measurements I am calculating is done at the client for speed. Projecting things at this point, would take a call to a geometry server and would slow things down.
All that being said, I would start by adding a new graphicsLayer just for displaying coordinate information. It will make it easier to manage the coordinate graphics. Find the _measureClickSegment function. At the end of the if (gra) operation add logic to add the coordinate x and y information graphics. I serialize each graphic with this.editGraphicID, so I can properly associate all of the appropriate text with the graphic. You should set the same ID for each coordinate graphic too. The lastPoint variable, when populated will contain the x and y information of the coordinates. Your code would look something like this:
var coordText = lastPoint.x + ", " + lastPoint.y
var textSymbol = new TextSymbol(coordText, symbolFont, fontColor);
textSymbol.setOffset(10,10);
var att = {id: this.editGraphicID, index: 999};
var coordGraphic = new Graphic(lastPoint, textSymbol, att, null);
this.coordinateLayer.add(lengthGraphic);
This should be a good starting point for you to add coordinates to each segment you add to a polyline and polygon geometry.
Regards,
Tom
Ryan,
Thanks very much! Glad you like it. You can override the default value by adding 2 lines of below line 124 in the measure Widget.js. It will look like this:
this.textSymChooser.textPreview.innerHTML = "Sample Text"; // line 124
this.textSymChooser.textFontSize.value = 12;
this.textSymChooser.textFontSize.textbox.value = "12";
Regards,
Tom
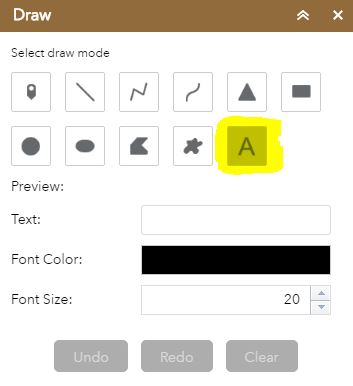
How difficult would it be to add Text just like the Draw widget?
Justin,
I am not sure I understand your request. The measure widget was created to provide measurements of different geometry types. Are you wanting to measure text in some way? Or are you just wanting the measure widget to add additional text to the map? If you are wanting to add text to the map the draw tool is ideal for this purpose.
Regards,
Tom
Maybe what he's getting at is, if your widget had the ability to add text (and actually point graphics as well), then it would make the Draw widget pretty much obsolete. Adding text and points is out of the scope of your widget of course, but the functions of two similar widgets could be replaced with one.
Ah, if that is the case then I would prefer to keep it in context. It was created to measure geometries.
Ryan Kelso was right. It would be useful to combine the functions of these two widgets that already have a lot of overlapping functions.
I appreciate you sharing your widget to the community.
Hello,
Thanks a lot for this great tool! Users find it very useful. Someone asked me if there is an option to hide the measurements for length when they want to see only the area size.
I couldn't find a way to do it and I was wondering how complicated it might be? I suppose it would be best to have another checkbox for that.
Thanks,
Shay.
Shay,
I can look into adding another checkbox that removes the segment measurements. As an alternative you can also use the Draw widget to draw shapes that will give area and perimeter measurements.
Regards,
Tom
oh great! Thanks for the tip  It's very elegant to tell users to use a different widget for hiding the length measurements but I guess it will do for now.
Shay.
Hi tsellste,
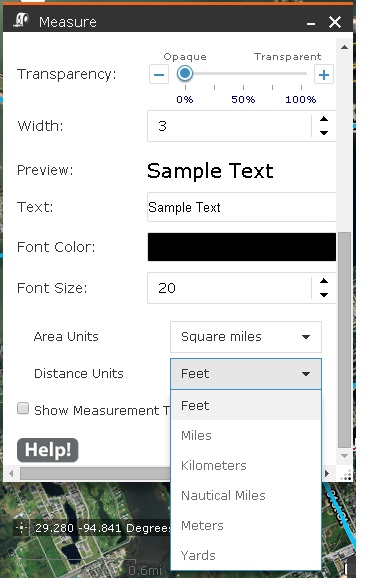
This is a great widget that I use in replacement of the out of the box Measurement tool in most of my applications! I was wondering if there's a way to change the default font size specified in the widget? It's currently set at 20, and I'd like to change that so when users open the tool it's set to a different font size by default. I'm having trouble finding this in the widget code - if possible, could you please point me in the right direction?
Thanks in advance for your help,
Jacqueline
Jacqueline Kovarik check out Tom's comment here: link
edit: fixed the link
Jacqueline,
Thanks very much! You can override the default value by adding 2 lines of below line 124 in the measure Widget.js. It will look like this:
this.textSymChooser.textPreview.innerHTML = "Sample Text"; // line 124
this.textSymChooser.textFontSize.value = 12;
this.textSymChooser.textFontSize.textbox.value = "12";
Regards,
Tom
Measure Widget Users! I have posted an update that fixes a problem with editing measures. The widget was using a couple of event listeners, but recently one was being ignored. This has been fixed and the widget is functioning properly now.
Sorry if I missed this in previous postings, is there a way to have Show Measurement Totals default to checked? didn't see anything in the config
Hey James,
I've adjusted this by adding a "checked" attribute to the showTotals checkbox element in the Widget.html file. This adjustment can be made on line 35.

Jacqueline
James,
There is no configuration option, but you can modify the code in the Widget.html. Line 35 in the latest version would add "checked" after the type="checkbox".
34: <div style="margin-bottom:7px;">
35: <input data-dojo-attach-point="showTotals" type="checkbox" checked />
36: <label data-dojo-attach-point="showTotalsLabel">${nls.showTotals}</label>
37: </div>
Regards,
Tom
Hi Tom!
I've had repeated requests to add the running total to the regular polyline like it is in the freehand polyline. Is this something that can be done?
Thanks!
Eric
Yeah, it would be really cool if that were possible, Tom.
Also, I had a user ask the other day if it were possible to delete a single measurement if you have marked up your map with multiple measurements. Kind of like how you can select a polyline measurement and delete a vertex (which is also very cool), but on the line itself. Or if there are only two vertices left, deleting one of them deletes the line, maybe? Thanks again for this great widget!!