- Home
- :
- All Communities
- :
- User Groups
- :
- Web AppBuilder Custom Widgets
- :
- Documents
- :
- Elevation Profile Widget Version 2.24 - 8/3/2022
- Subscribe to RSS Feed
- Mark as New
- Mark as Read
- Bookmark
- Subscribe
- Printer Friendly Page
Elevation Profile Widget Version 2.24 - 8/3/2022
Elevation Profile Widget Version 2.24 - 8/3/2022
Web AppBuilder for ArcGIS | Help - Elevation Profile Widget
List of the latest enhancements and changes:
- Added setting to change the coordinate system (WKID) of the exported profiles csv coordinates.
Older enhancements or changes
- Fixed issue with precision missing from settings UI
- Updated to WAB 2.17
- Fixed issue with using this widget in Tab Theme. Profile hiding the close button on the sidebar controller.
- Now when used in the Jewlerybox and tab theme it will open those controllers automatically.
- Added ability to select existing line features to profile.
- Added ability to choose which segment of the selected polyline to profile.
- Added setting to control elevation decimal precision.
- Fixed Issue with resizing widget and profile getting cut off.
- Moved all widget links to a widget menu instead.
- Added the ability to export Profile data to CSV file.
- Added the ability to flip the profiles direction of travel.
- Added support for doing profiles when basemap is not Web Mercator
- Added the ability to export the profile chart as an image (if you are not using Internet Explorer and your browser supports HTML5 Canvas).
- Added fix for Launchpad Theme UI issues
Features:
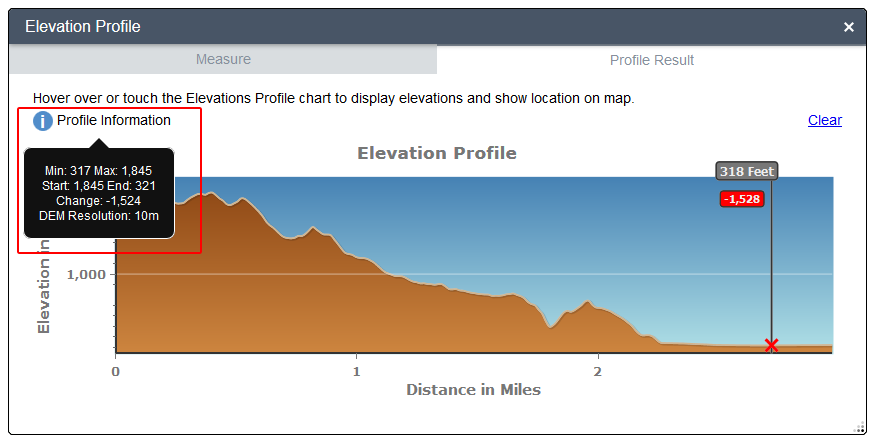
- This is a port over of the Elevation Profile Template.
- Some modifications have been done to prevent chart indicator text clipping
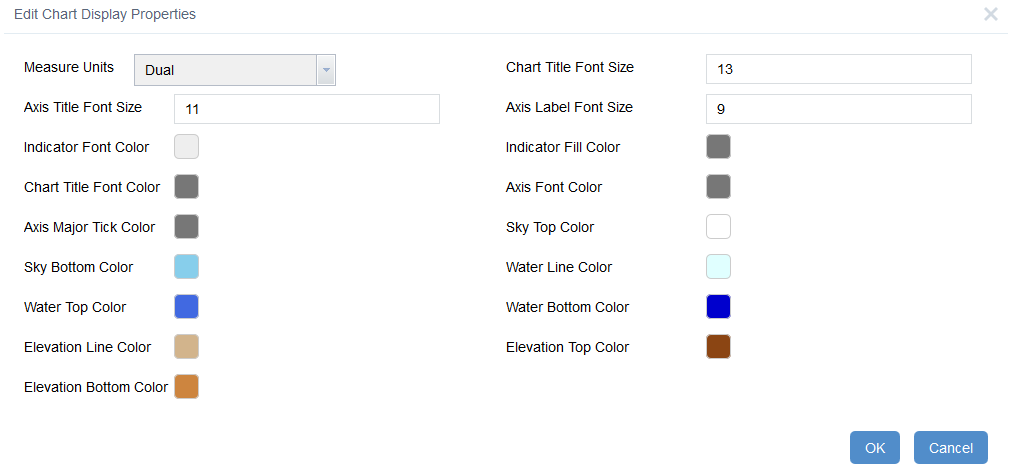
- The chart display features like color, font size, etc are all configurable in the widget settings UI
- Some validation is done on the profile task service url.
- Full help documentation is provided for configuring and using the widget.
Stephen,
I will have to look into this possibility as an enhancement for a future release.
All,
Check out the new ability to export profile data to CSV and to flip the profiles direction of travel in the latest release.
2.4.2 works perfectly so far, but if you resize the profile window, the 3 dots for the menu can become conflicted with the text:
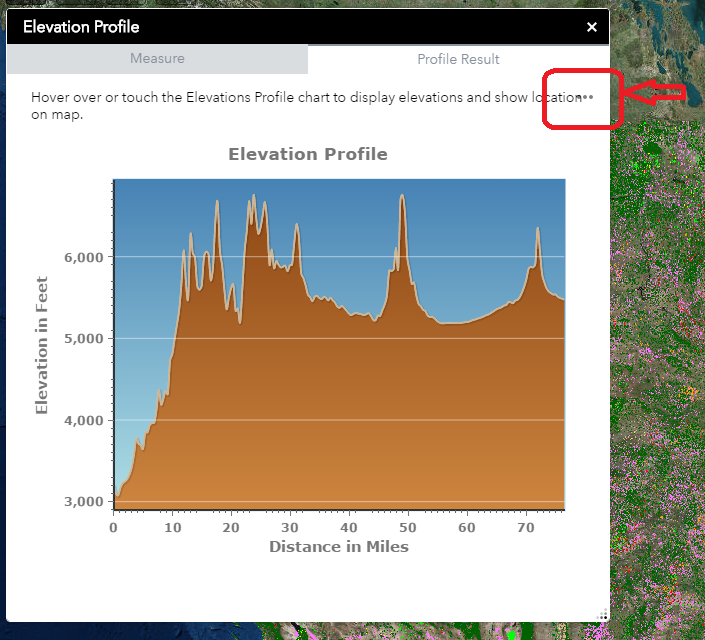
Is there a way to create a small buffer to left of the menu icon?
Barnaby,
I will update the download with the fix (but won't increment the version as there is like very few that have downloaded yet). The fix is to add line 5 to the style.css result-div rule:
.widget-elevation-profile .result-div{
font-size:14px;
padding-left:10px;
padding-bottom:5px;
margin-right: 20px;
}Excellent, Robert. I'll try that out in a minute...
Perfect!
Please post here when you have updated the download.
updated
Hi Rob,
Thank you so much for the updated Elevation Profile. I am wondering if could be possible to put your own ymax and ymin as I would like to compare different profiles so it would be better using same values for all charts.
Thanks,
María
Maria,
Sure I will consider it for a future release.
Robert,
Does this widget calculate percent slope of the two points and have it display inside the widget window? I use this widget a lot but i find my self calculating the percent slope as well. Could this be something that you could include in this widget and maybe add it to the profile results window?
Awesome widget by the way!
So you are talking about the simple math of min and max difference?
Slope (gradient percent ) degree of inclination.
Hi Robert . I noticed that when i use the Elevation Profile widget and if i close the widget or use the "Clear" to clear the current profile and then move some where else and open it back up it has the profile of the last profile i did. So i the "Clear" is truly not working?
This will be fixed in the next release. The change is simple if you want to add it before then (add line 2 to the _clear function).
_clear: function () {
this.lastMeasure = null;
this.currentProfileResults = null;
html.setStyle(this.divOptions, 'display', 'none');
this.prepareVis = false;
html.setStyle(this.btnDownload, 'display', 'none');
this.clearProfileChart();
this.tabContainer.selectTab(this.nls.measurelabel);
this.measureTool.clearResult();
return false;
},Got it thanks!
Hi Robert.. this is a fantaswtic tool but i have lost the option to use the menu and download the csv in WAB 2.5 can you assist (it doesnt appear on your live test either!)
David,
Somehow I uploaded an older version. I have fixed the issue now, so please re-download. The live site is now fixed as well.
Thank you!
The profile is not drawing for me in MS Edge, but appears fine in other browsers. The widget area where the profile should be drawn is blank.
IE strikes again... Add this css rule to the widget css/style.css file:
.widget-elevation-profileChartNode > svg {
  width: inherit !important;
  height: inherit !important;
}
Thank you, Robert! I'll try that out on Monday.
Stephen,
It probably is but I do not have that on my radar.
Robert, this is an incredible tool! I see a lot of potential to use this with our company. I'm curious about a couple of things that I unfortunately do not have the experience (or brainpower) to comprehend. I've seen some discussion on it, but it's over my head at this point. We would like to be able to deploy this widget on our WAB with a DEM created from drone data; perhaps, using Drone2Map.
Would this widget be able to handle that type of accuracy/resolution? Also, can it be modified to manage this workflow? I'm still trying to understand the Profile Task Url and how we can turn our DEM into a Profile Task Url. Would that be the same as creating a feature service layer in AGOL and plugging that URL in? Thank you in advance for your assistance.
Erik,
The widget will handle what ever resolution the service provides. Here is a blog on how to setup your own elevation service:
Erik,
I believe it would require an ArcGIS Server.
Hello all,
I am trying to customize an elevation chart widget since the chart display is exactly what I want. However, I have a table with Distance and Elevation values that I want to be able to query based on user input. I know the elevation chart uses a GP service, which I don't think I need to do since the values are confined to a specific line and not a dem. This should be pretty straight forward with creating a chart from a user specified input, but I can not figure out how to implement this either in the elevation widget, the chart widget, the related table chart widget, or even the custom barChartCedar since there are a lot of other functions going on in each. I have a custom javascript application that I am trying to convert into a WAB application, and have a custom query/chart built into it. I am trying to use the same code, but have been realizing that WAB is structured differently. Any direction is appreciated. Here is part of the the .js code from my running custom .js app:
var layerInfo = [];
var legendLayers = [];
var legend;
var legendCount = 0;
var seriesid = 1;
var count = 0;//Create the chart
var chart = new Chart("chartDiv");//Create the legend
var legendtwo;//Add points feature layer
var pointsLayer = new FeatureLayer("https://...MapServer/26", {
mode: FeatureLayer.MODE_SELECTION,
outFields: ["*"]
});var queryTask = new QueryTask("http://...MapServer/26");
//console.log(queryTask);//Add Query
var query = new Query();
query.outFields = ["*"];
on(dom.byId("execute"), "click", _execute);function _execute() {
query.where = "season='" + dom.byId("SeasonName").value + "' and year=" + dom.byId("YearName").value + " and line=" + dom.byId("LineName").value + "";
pointsLayer.selectFeatures(query, FeatureLayer.SELECTION_NEW, querycallback);
legendLayers.push({
layer: pointsLayer,
title: 'Profile Points'
});
}
//console.log(query);//Get the chart info from the query results
//Add Querycallback
function querycallback(results) {
console.log(results);
if (results.length !== 0) {
var chartData = arrayUtils.map(results, function(feature) {
return {
x: feature.attributes.Dist,
y: feature.attributes.Z
};
});
chart.setTheme(Tom);
chart.addPlot("default", {
type: "Lines",
tension: "S",
markers: true
});
chart.addAxis("x", {
title: "Distance Feet",
titleOrientation: "away",
titleFontColor: "#999"
});
chart.addAxis("y", {
vertical: true,
title: "Elevation",
titleFontColor: "#999"
});
// Add the chartdata
var color = ["red", "yellow", "cyan"];
chart.addSeries("<div style='display:none'>"+seriesid++ +":</div>"+dom.byId("YearName").value + " " + dom.byId("SeasonName").value + " " + dom.byId("LineName").value , chartData, {plot:'other',stroke:{color:color[colorindex]}});
colorindex = colorindex % 3;
colorindex++;
chart.updateSeries();
// dojo.setStyle(dijit.byId("chart").domNode, 'display', 'inline');
// dojo.byId("chart").style.height = '300px';
// dijit.byId("content").resize();
// Render the chart!
chart.render();// Create the legend
var node = dom.byId("surfaceDiv");
var legendID = "legend" + legendCount++;
var nodes = "<div id='" + legendID + "' ></div>";
html.set(node, nodes);
var nodeLegend = dom.byId(legendID);
legendtwo = new SelectableLegend({
chart: chart,
horizontal: false,
outline: true
}, nodeLegend.id);
} else {
alert("No results");
}
}
});
// // Remove the series from the chart
// on(dom.byId("reset"), "click", function() {
// var j = chart.series.length;
// for (var i = 0; i < j; i++) {
// chart.series.destroy();
// }
// chart.series = [];
// legendtwo.destroy();
// dojo.setStyle(dijit.byId("chart").domNode, 'display', 'none');
// dijit.byId("content").resize();
// });});
HI rscheitlin, Is this widget supported as an item in Portal for ArcGIS version 10.6? When I try to load it I just get the waiting gif, and it appears to be looking for a CSVUtils.js file that it can't find.
Thanks!
Marc
Marc,
Same as the eSearch you have to copy the jimu/CSVUtils file from WAB Developer. I am not sure why they maintain a different set of library files in Portal from the standard WAB.
Hey Robert. I was wondering if you are going to look at the option to select a line from a feature service to generate the profile graph? This would be very useful.
Is this also available using a 3D WAB app?
Thanks.
Julian
Julian,
I have considered it before but never got around to it. No the Profile widget is not able to be used in 3D apps.
I am also looking to use this widget in a 3D application. Any ideas on how this widget can be modified to work in my 3D application (version 2.8)?
Thanks!
Tess
Hi Robert,
First of all, thank you for this widget.
Can it be modified so that the decimals in elevation values would appear?
Is it possible to add some kind of input field where the user can adjust the water level?
With this css rule added to style.css, if I resize the window, the bottom part of the chart disappears:
.widget-elevation-profileChartNode > svg {
width: inherit !important;
height: inherit !important;
}Thank you.
Kummer,
I have adding the ability to configure decimal precision and commented out the css rule causing the issue with resizing. As far as the ability to manually set the sea level, I don't have any plans to add that currently.
Robert,
Thank you for the modifications, they work perfectly.
I understand that you don't want to include the ability to manually adjust the sea level, but in inland areas where water levels are above zero, this modification would be very useful. Unfortunately, rivers, lakes and other flooded areas can't be visualized easily at the moment. First, they need to be exported and reprocessed.
Nonetheless, the widget is excellent. If you should still add that ability, that will be highly appreciated.
How can I set the widget from WAB 2.8 to WAB 2.5?
Thanks
Have you tried to use the 2.8 version in WAB 2.5?
Afternoon Robert,
Is there a small code change I could make to the widget.js file to rotate the X axis labels for Distance (particularly Distance in Feet US)? The labels run together in some cases, and I think rotating them 90 degrees would eliminate this.
Thanks,
Matt,
Sure in the Widget.js find this block and add the rotation property (line 13):
// X AXIS //
this.profileChart.addAxis('x', {
fontColor: this.chartRenderingOptions.axisFontColor,
font: lang.replace('normal normal bold {axisLabelFontSize}pt verdana', this.chartRenderingOptions),
natural: true,
fixed: true,
includeZero: false,
majorLabels: true,
minorLabels: true,
majorTicks: true,
minorTicks: true,
htmlLabels: false,
rotation: 45,
majorTick: {
color: this.chartRenderingOptions.axisMajorTickColor,
length: 6
},
title: lang.replace(this.nls.chart.distanceTitleTemplate, [this._getDisplayUnits(false)]),
titleGap: 5,
titleFont: lang.replace('normal normal bold {axisTitleFontSize}pt verdana', this.chartRenderingOptions),
titleFontColor: this.chartRenderingOptions.titleFontColor,
titleOrientation: 'away'
});Robert,
Thank you for developing this fantastic widget! Are there any plans to make this widget compatible with a 3d Scene Web App or adding personal elevation services through AGOL?
Thanks
Nate,
Currently no 3D plans, but you can already set the elevation service in the widget settings dialog.
Hello Robert, thanks for the widget. Trying to registering it with portal, I am getting the error:

Can you help me setting the widget to be used in a Web AppBuilder app? I already check enabling CORS and the anonymous authentication on IIS.
Best regards
David,
I am not a Portal user personally. I don't know why you are getting this error. Are there any errors in your web browsers console when this happens?
Hi Robert
Is there anyway to export profile data in different CRS ? I believe currently it is using WGS84 (WKID - 3857/102100).
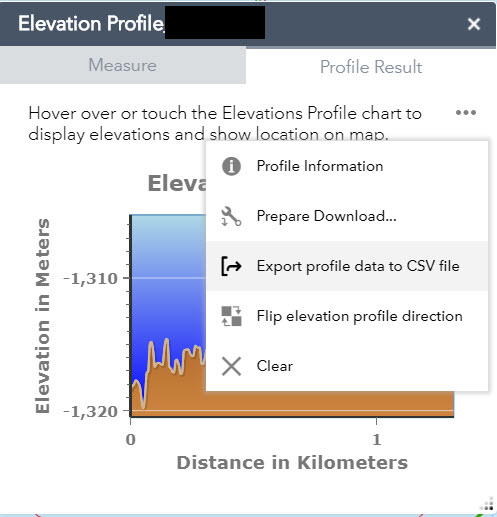
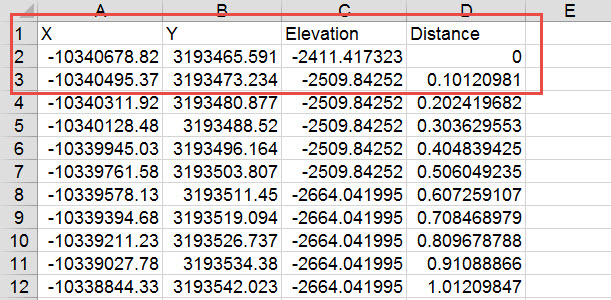
Currently No.
Thank you Robert for quick response.
If I have to do that by modifying the code, where should I do that ? Any pointer will be great.
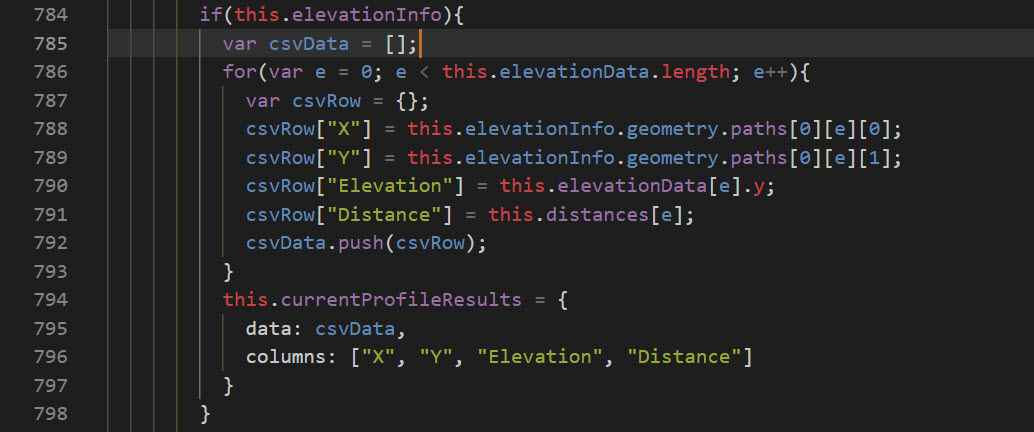
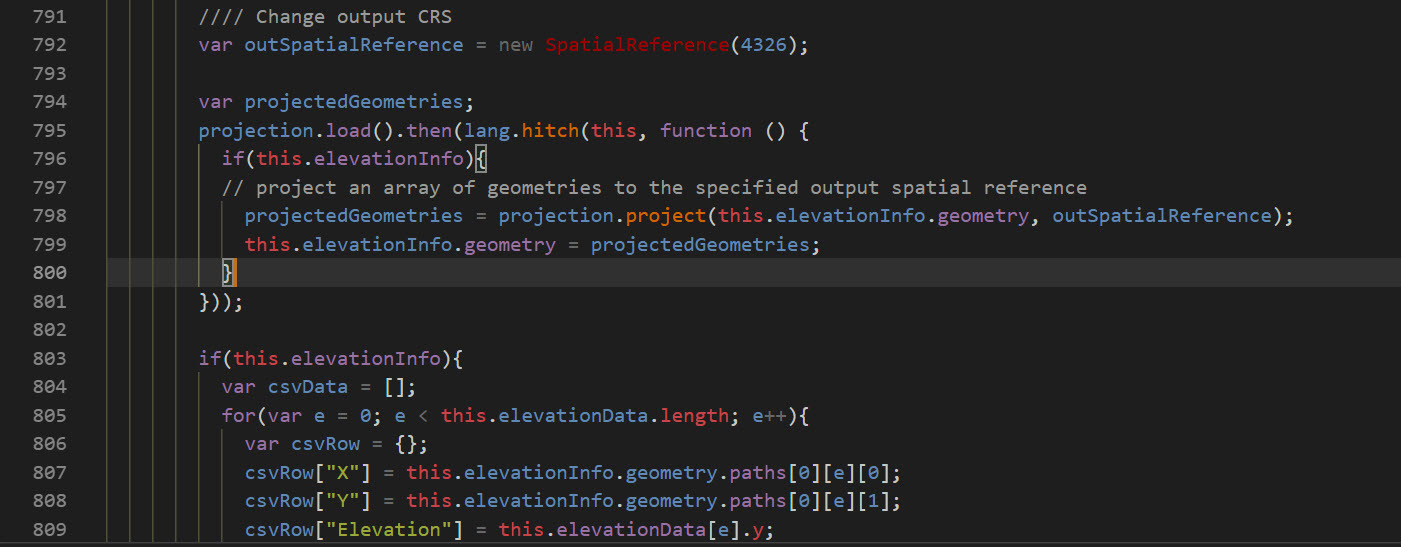
Use a geometry service to re-project thethis.elevationInfoGeometry before it is exported (somewhere before line 784).
Thank you Robert. I was able to do that by inserting few lines of code above line 784
