- Home
- :
- All Communities
- :
- Industries
- :
- Water Resources
- :
- Water Resources Questions
- :
- Flow direction data error?
- Subscribe to RSS Feed
- Mark Topic as New
- Mark Topic as Read
- Float this Topic for Current User
- Bookmark
- Subscribe
- Mute
- Printer Friendly Page
Flow direction data error?
- Mark as New
- Bookmark
- Subscribe
- Mute
- Subscribe to RSS Feed
- Permalink
for a school group project we were given a pre processed DEM built from lidar point cloud.
We have had tons of issues with the DEM (.tiff) due to the size of the file but have been able to run the tools by cutting out the required data and re-sampling call size to 5m.
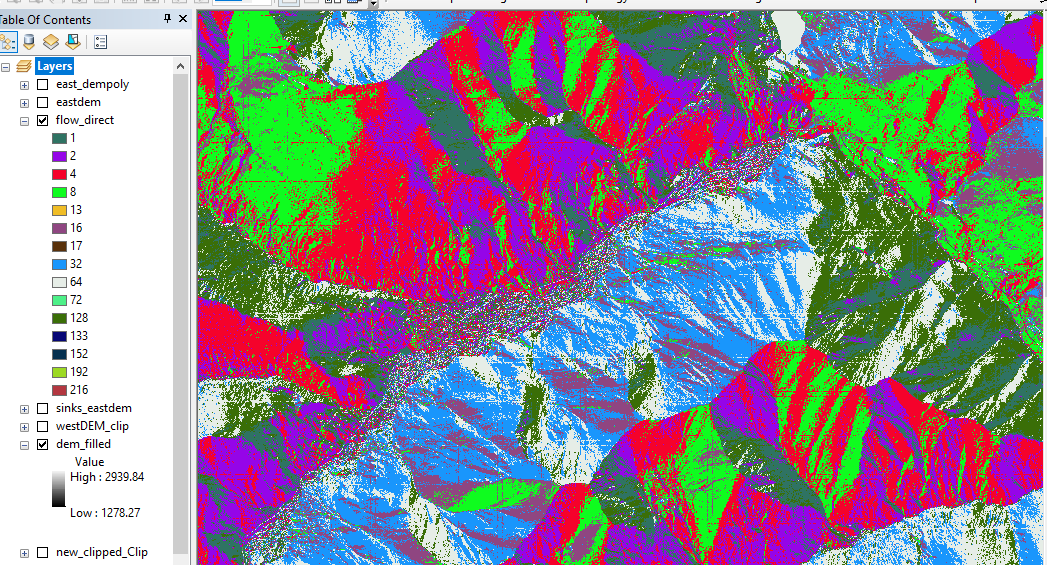
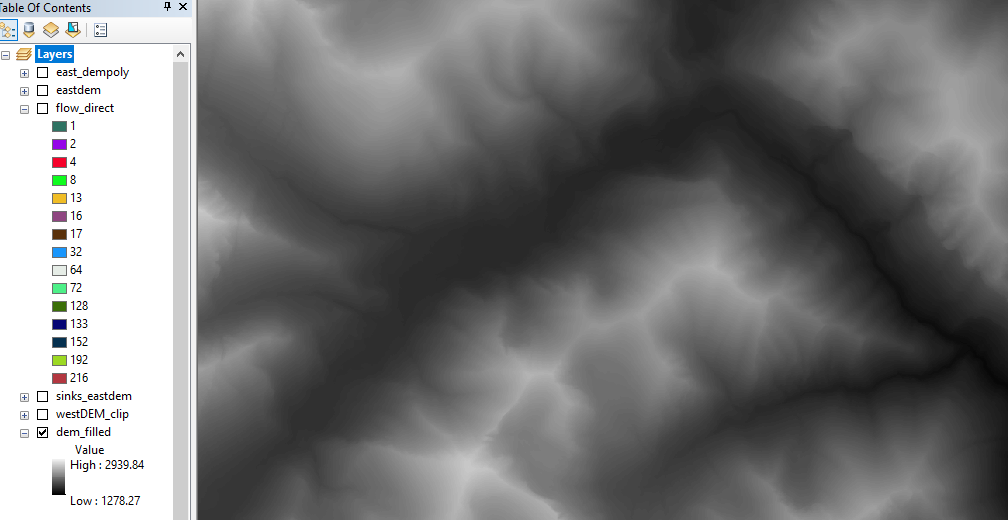
After running fill sinks and flow direction the data shows a uniform grid that was undetectable in the DEM and Slope calculations.
I am curious if anyone has dealt with this before, or have any idea if this could come from some rendering issues with the large data, or if there is some kind of error in the data.
(The project is research based. I'm not just looking for easy answers for a lab assignment)
Thanks!
- Mark as New
- Bookmark
- Subscribe
- Mute
- Subscribe to RSS Feed
- Permalink
What resampling method did you use? http://pro.arcgis.com/en/pro-app/tool-reference/data-management/resample.htm
Given the data are not categorical, did you examine the remaining options and their affect on the resultant dem prior to filling sinks.
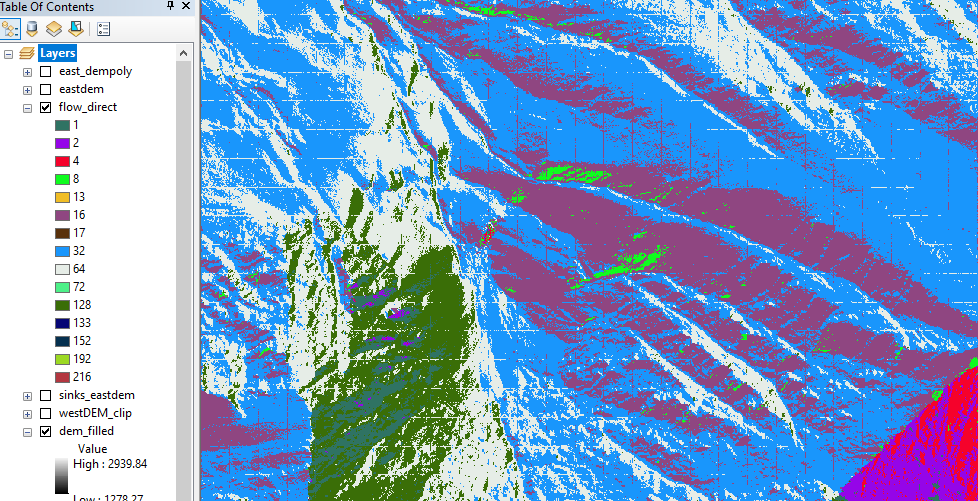
What do you think would be the cause of the rectilinear pattern evident in the first two images?
Are they the result of any initial preprocessing to produce the dem or are they the result of resampling and other processing steps?
These are some of the questions I would ask if I had given the project out 
- Mark as New
- Bookmark
- Subscribe
- Mute
- Subscribe to RSS Feed
- Permalink
When you zoom in to the flow direction raster, does the grid remain visible? You may need to calculate your pyramids again: Build Pyramids—Help | ArcGIS Desktop
- Mark as New
- Bookmark
- Subscribe
- Mute
- Subscribe to RSS Feed
- Permalink
Yes they stay visible throughout. Which leads me to believe there must be a error in the data, because rendering issues would remedy itself at large scales (Maybe I dunno).
I will try and give the pyramids a shot!
thanks
- Mark as New
- Bookmark
- Subscribe
- Mute
- Subscribe to RSS Feed
- Permalink
Did you try to rebuild the pyramids? Although as you describe, if the line is there at all scales it will probably not be the solution.
If you zoom in to pixel level, are the lines a single pixel thick or are they wider?. You could set those pixels to NoData and then use a focal statistics operation to fill them using a mean of the known values around the NoData pixel. If the the lines and just a single pixel wide, and evenly spaced you could even create a fishnet and use the outlines in a SetNull or Con operation to set those pixels to NoData.
- Mark as New
- Bookmark
- Subscribe
- Mute
- Subscribe to RSS Feed
- Permalink
We actually got the lines in the original interpolation and then re-sampled to try and eliminate them.
We don't actually know what other pre-processing was done... the DEM was given to us from an outside organization.
(I wish that this was a given assignment because then my prof. could help. we are doing a final research project on modeling changes in stream flow post fire to measure the effect on current infrastructure.)
- Mark as New
- Bookmark
- Subscribe
- Mute
- Subscribe to RSS Feed
- Permalink
Sara, that is why I asked what kind of resampling you did. The bilinear and cubic should/might have smoothed out some of those artifacts.
- Mark as New
- Bookmark
- Subscribe
- Mute
- Subscribe to RSS Feed
- Permalink
I was not sure what re-sampling my team member used. I'm sure he used nearest neighbor just because we where having trouble with the size.
I tried to run both cubic and bi linear and I got the same patterns but not in the same locations......
- Mark as New
- Bookmark
- Subscribe
- Mute
- Subscribe to RSS Feed
- Permalink
oh actually the grid is the same
- Mark as New
- Bookmark
- Subscribe
- Mute
- Subscribe to RSS Feed
- Permalink
Nearest neighbor should not be used for a continuous surface like a DEM (DTM). As Dan mentioned bilinear and cubic are the ones that are appropriate.