- Home
- :
- All Communities
- :
- Products
- :
- Spatial Statistics
- :
- Spatial Statistics Questions
- :
- Re: Modeling spatial relationships
- Subscribe to RSS Feed
- Mark Topic as New
- Mark Topic as Read
- Float this Topic for Current User
- Bookmark
- Subscribe
- Mute
- Printer Friendly Page
- Mark as New
- Bookmark
- Subscribe
- Mute
- Subscribe to RSS Feed
- Permalink
Hello everyone,
Q1:
I’m reading the page of “Modeling spatial relationships” in ArcGIS Help 10.1. In the section “Selecting a fixed-distance band value”, there is one sentence: “The z-scores are reliable (even with skewed data) as long as the distance band is large enough to ensure several neighbors (approximately eight) for each feature.”
Does anyone know, what’s the mathematical basis of “eight neighbors”? Why are eight neighbors normally enough for a reliable z-score?
Q2:
Is there a tool in ArcGIS, with that I can calculate an average radius for every point, when they have, for example, eight neighbors?
Thank you all!
Solved! Go to Solution.
Accepted Solutions
- Mark as New
- Bookmark
- Subscribe
- Mute
- Subscribe to RSS Feed
- Permalink
1
2.1 To get the average of 8 values you can use Near tool and set search radius = x and closest count = 8.
2.2 Then use Dissolve tool to get the average. Use in_feature field and set statistics = MEAN.
ArcGIS Help (10.2, 10.2.1, and 10.2.2)
Hope this is helpful
Regards
Kishor
- Mark as New
- Bookmark
- Subscribe
- Mute
- Subscribe to RSS Feed
- Permalink
Thank you so much!
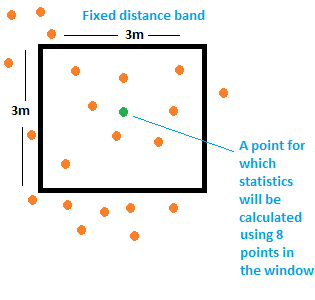
Could you please tell me what's the reference of the first picture?
Why is 3m x 3m?
- Mark as New
- Bookmark
- Subscribe
- Mute
- Subscribe to RSS Feed
- Permalink
I have created that picture to visualize the information and for better understanding. 3m is just an example you can set the distance to any appropriate value depending on the distribution of the points and the spacing between them so that the window covers approximately eight points.
I believe you could get the average distance values using step2 or try using Point file information tool and refer the output table.
Regards,
Kishor
- Mark as New
- Bookmark
- Subscribe
- Mute
- Subscribe to RSS Feed
- Permalink
Thank you again for your created picture. The tool you've told me is really very helpful, thank you.
I understand the meaning of the spacing relationship. I just want to know, why is 8 neighbors enough for a reliable z-score? but not 10 or 20 neighbors?
Is eight just an empirical value or is there any reference of it?
- Mark as New
- Bookmark
- Subscribe
- Mute
- Subscribe to RSS Feed
- Permalink
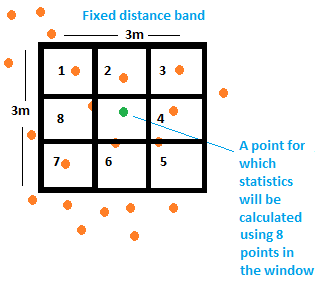
This happens with Raster datasets. However I am not 100% sure for vector data. I believe logic should be same. As fixed distance band window could be divided in this way and based on surrounding values (8) the middle value can be derived.
- Mark as New
- Bookmark
- Subscribe
- Mute
- Subscribe to RSS Feed
- Permalink
thank you for this answer!
- Mark as New
- Bookmark
- Subscribe
- Mute
- Subscribe to RSS Feed
- Permalink
Eight neighbors comes from the suggestion of Getis and Ord documented in their 1992 paper, The Analysis of Spatial Association by Use of Distance Statistics (link below). They were using Queen’s Case just like the graphic from Kishor. Mark Janikas also did empirical testing and found that eight nearest neighbors was generally enough neighbors to assure the test statistic was asymptotically normal for skewed data. This was accomplished by comparing the standard z-score with the pseudo p-value obtained via the permutation approach. He assessed the test statistic with a variety of distributions … Exponential, Poisson etc.
It is important to remember that 8 is a suggestion and not a magic number. The distance band value that you choose should make sense in the context of the question you are asking.
Here is the link to the paper: http://onlinelibrary.wiley.com/doi/10.1111/j.1538-4632.1992.tb00261.x/abstract
Hope this was helpful.
- Mark as New
- Bookmark
- Subscribe
- Mute
- Subscribe to RSS Feed
- Permalink
Thank you soooo much!! This is exactly what I need!!
- Mark as New
- Bookmark
- Subscribe
- Mute
- Subscribe to RSS Feed
- Permalink
Happy to help!
Best,
Jenora