- Home
- :
- All Communities
- :
- Products
- :
- Spatial Statistics
- :
- Spatial Statistics Questions
- :
- Re: Is it possible to create a time enabled hot sp...
- Subscribe to RSS Feed
- Mark Topic as New
- Mark Topic as Read
- Float this Topic for Current User
- Bookmark
- Subscribe
- Mute
- Printer Friendly Page
Is it possible to create a time enabled hot spot map?
- Mark as New
- Bookmark
- Subscribe
- Mute
- Subscribe to RSS Feed
- Permalink
I'm trying to put together a web app for a presentation using roughly 40,000 points that I've geocoded over a time period of about 2 years. I've aggregated the points by month and added a date field to each months feature. Using spatial statistics, I've been able to create a point density map showing 'hot spots' by month. Each raster was then placed in a raster mosaic in which I could enable time to. I can go though month by month, showing how the incidents differ.
Unfortunately, we don't have the image service extension for ArcGIS server, so I am unable to create an image service for the mosaic.
I've tried now using hot spot analysis. I've created a hot spot map for each month.
Is there a way to combine this data and time enable it while keeping the confidence level set for each month?
Thanks!
- Mark as New
- Bookmark
- Subscribe
- Mute
- Subscribe to RSS Feed
- Permalink
The requirements for time-enabled data are listed here http://desktop.arcgis.com/en/arcmap/latest/map/time/enabling-time-on-your-data.htm
but is sounds like you want to animate in a slightly different way,
There are some suggestions here http://desktop.arcgis.com/en/arcmap/latest/map/time/what-is-temporal-data.htm
And I suppose you don't want to go the route of space-time cube http://desktop.arcgis.com/en/arcmap/latest/tools/space-time-pattern-mining-toolbox/create-space-time...
or the emerging hotspot analysis
or is it you just need an animation script to automate the changing the visibility of layers in a dataframe/map
- Mark as New
- Bookmark
- Subscribe
- Mute
- Subscribe to RSS Feed
- Permalink
Thanks for the reply, Dan. I looked at the links you provided and I'm not sure creating a space time cube or doing an emerging hot spot analysis is what I want to do for this information. I simply want to view the data by month to see the where incidents are prevalent and then publish it in a web app.
Here are example of the work.
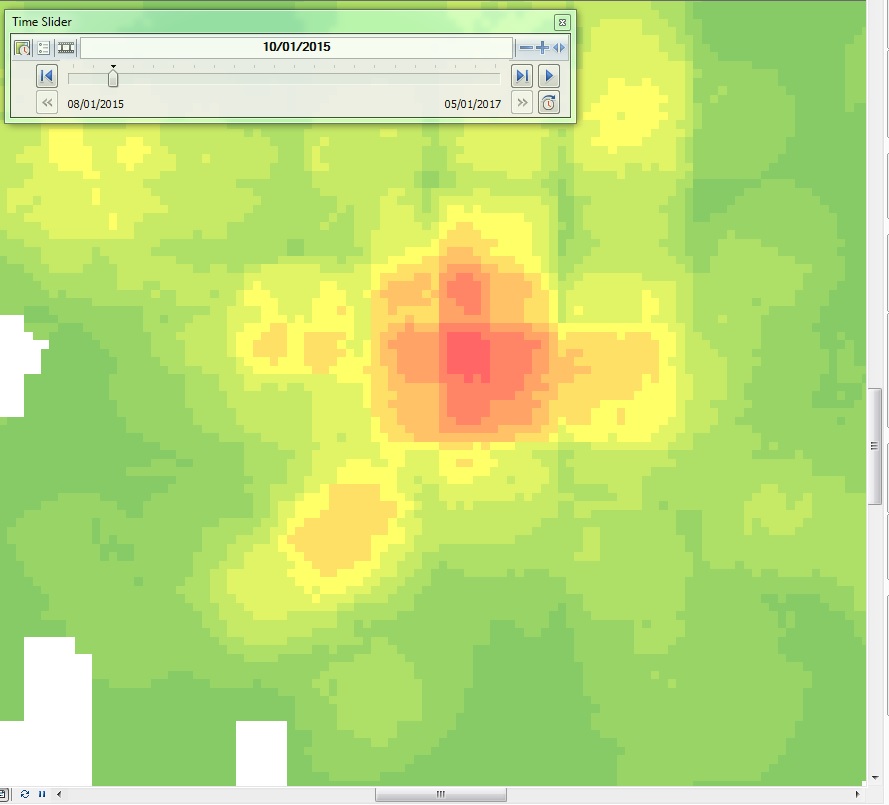
In the raster below, I can click through the months to see where incidents are occurring geographically.
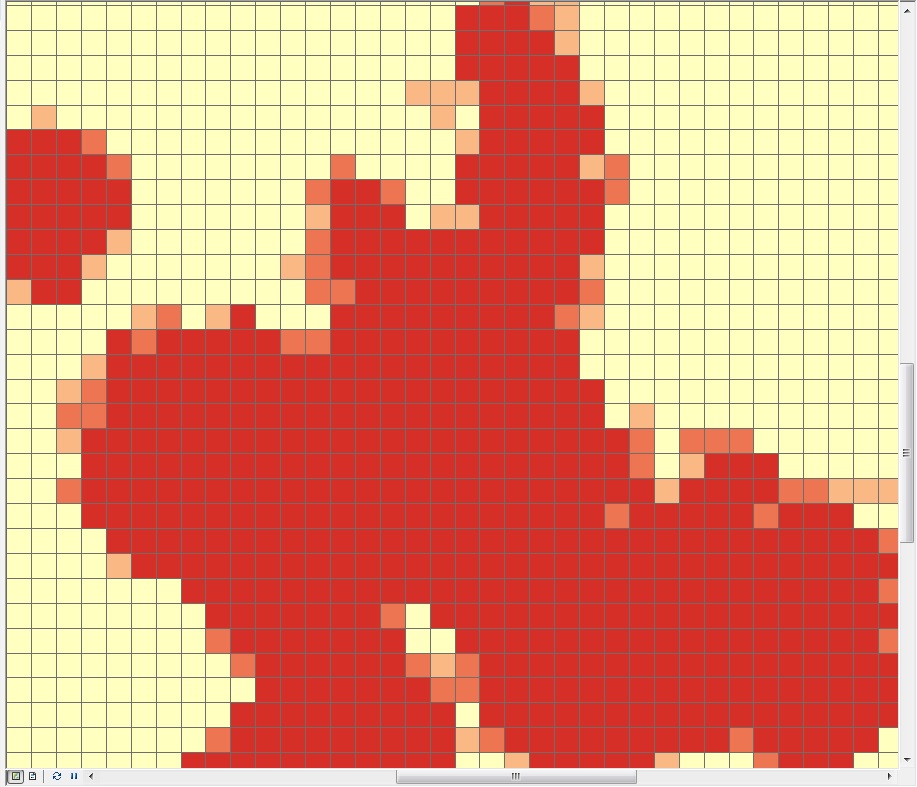
In the hot spot map below, I can see where there's high confidence of incidents, but I don't believe I can display all the individual hot spot maps like the raster above to show the pattern over time.
My guess is that I'm at a licensing limitation, being that I cannot publish the raster as an image service.