- Home
- :
- All Communities
- :
- Products
- :
- Spatial Data Science
- :
- Spatial Data Science Questions
- :
- What does a negative value of Mean Error indicate?
- Subscribe to RSS Feed
- Mark Topic as New
- Mark Topic as Read
- Float this Topic for Current User
- Bookmark
- Subscribe
- Mute
- Printer Friendly Page
What does a negative value of Mean Error indicate?
- Mark as New
- Bookmark
- Subscribe
- Mute
- Subscribe to RSS Feed
- Permalink
- Mark as New
- Bookmark
- Subscribe
- Mute
- Subscribe to RSS Feed
- Permalink
from here
Performing cross-validation and validation—ArcGIS Pro | ArcGIS Desktop
You want your predictions to be unbiased (centered on the true values). If the prediction errors are unbiased, the mean prediction error should be near zero. However, this value depends on the scale of the data; to standardize these, the standardized prediction errors give the prediction errors divided by their prediction standard errors. The mean of these should also be near zero.
and you have -0.0081... which is good. The explanation of what it is, is given in the quote from the link
- Mark as New
- Bookmark
- Subscribe
- Mute
- Subscribe to RSS Feed
- Permalink
Thanks for the answer. I did read the link a long time ago. What my confusion is the negative value of the 'mean error'. I don't understand what the '-' sign tells here about the model or data.
- Mark as New
- Bookmark
- Subscribe
- Mute
- Subscribe to RSS Feed
- Permalink
it says nothing about the model or the data other than the absolute value is extremely close to zero which is good, but its value is to the left of 0.
- Mark as New
- Bookmark
- Subscribe
- Mute
- Subscribe to RSS Feed
- Permalink
Fine. Then does it mean I can report the results without any additional ifs and buts??
- Mark as New
- Bookmark
- Subscribe
- Mute
- Subscribe to RSS Feed
- Permalink
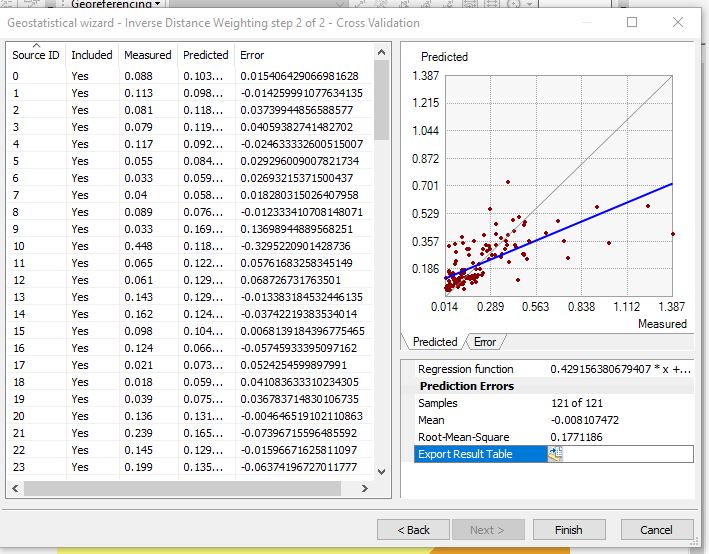
I would be more concerned by how much your regression line deviates from the 1:1 line in your image.
You don't draw conclusions from a single value, you have to look at the distribution of the data you have and your derived relationships (regression equation, and R squared etc)
- Mark as New
- Bookmark
- Subscribe
- Mute
- Subscribe to RSS Feed
- Permalink
I agree with Dan. The Predicted vs Measured line is fairly flat, and the scatterplot is pretty noisy. Also, the values in the Error column are fairly large relative to the measured values (often above 50% of the measured value).
If I were you, I would be much more concerned about accuracy than bias. I don't see any reason to doubt that the model is unbiased, but these numbers and graphs are pretty typical when the data does not have very much autocorrelation or is very noisy.
- Mark as New
- Bookmark
- Subscribe
- Mute
- Subscribe to RSS Feed
- Permalink
Agreed. I too felt the issue of autocorrelation. Thanks once again
- Mark as New
- Bookmark
- Subscribe
- Mute
- Subscribe to RSS Feed
- Permalink
Thanks Dan for your answer.
- Mark as New
- Bookmark
- Subscribe
- Mute
- Subscribe to RSS Feed
- Permalink
The mean error is the average of all the cross validation errors. A positive error means that the predicted value is larger than the true value, and a negative error means that the predicted value is less than the true value. For unbiased models, the underpredictions should cancel out the overpredictions on average, and the mean error should be close to zero. Sometimes it will be little bit negative, sometimes a little bit positive, but if it is close to zero, you have evidence that the model is unbiased.
Your value literally means that on average, the cross validation predictions were 0.0081 lower than the true values. Since I can see in your screenshot that your measured values range from about 0.03 to 0.24, a value of -0.0081 is negligible. If the mean error were instead something like 0.1, that would be very concerning, as the level of bias would be as large as most of the measured values.