- Home
- :
- All Communities
- :
- Products
- :
- Spatial Data Science
- :
- Spatial Data Science Questions
- :
- Re: Just started using ArcMap - is this kind of an...
- Subscribe to RSS Feed
- Mark Topic as New
- Mark Topic as Read
- Float this Topic for Current User
- Bookmark
- Subscribe
- Mute
- Printer Friendly Page
Just started using ArcMap - is this kind of analysis possible?
- Mark as New
- Bookmark
- Subscribe
- Mute
- Subscribe to RSS Feed
- Permalink
I have 2 files, a shapefile (.shp) and a raster file (.tif). The .tif is merely 2 bands (0 and 1) where 0 represents no forest loss and 1 represents forest loss (file is from here: http://earthenginepartners.appspot.com/science-2013-global-forest/download_v1.1.html) The .shp consists of polygons that represent protected areas (file is from here: http://www.protectedplanet.net/).
What I'd like to do is try a statistical analysis that would simply tell me how much forest loss ("1" points in the .tif) lies within the protected areas and how much loss lies outside the protected areas (in the .shp).
I'm wondering if it's possible to do this in arcmap/arcgis and if so how would I do this?
Sorry if this seems like a stupid question, I haven't been using the software for long and I couldn't find anything online.
Solved! Go to Solution.
- Mark as New
- Bookmark
- Subscribe
- Mute
- Subscribe to RSS Feed
- Permalink
What kind of computer are you running ArcMap on?
- Mark as New
- Bookmark
- Subscribe
- Mute
- Subscribe to RSS Feed
- Permalink
It's a desktop with 64bit windows 7, a reasonably fast AMD quadcore, GPU, 8GB RAM and a SSD hard drive. Even so it has taken my PC all night to work through all these suggestions with trial and error, I don't mind as I'm doing this for a university project but for someone with less time than me I think you'll want to cut down the file sizes 
- Mark as New
- Bookmark
- Subscribe
- Mute
- Subscribe to RSS Feed
- Permalink
Yes, the first thing I did was resample the raster. I think for this level of analysis you can get away with a larger cell size. This enabled me to perform a Tabulate quite quickly. Unfortunately, since your data is in Geographic Coordinate System (lat/long) the area result is in degrees, which is meaningless. So step two will have to be Projecting the raster into a local coordinate system, such as UTM.
- Mark as New
- Bookmark
- Subscribe
- Mute
- Subscribe to RSS Feed
- Permalink
Ok for the resample (as that sounds like a fine idea) what's best to put in the fields (Cell size, X, Y, Technique)? I think you're right the larger cell size won't hurt the result too much and if it means I can cover a larger area in the time I have then it's worth it. Also would you mind sharing what you input for tabulate as well? I think I can change the coordinate system (or easily look it up) so at least I have that one covered.
It's much easier when someone knowledgeable helps with this so I appreciate it, I'm learning
- Mark as New
- Bookmark
- Subscribe
- Mute
- Subscribe to RSS Feed
- Permalink
Here's the resample:

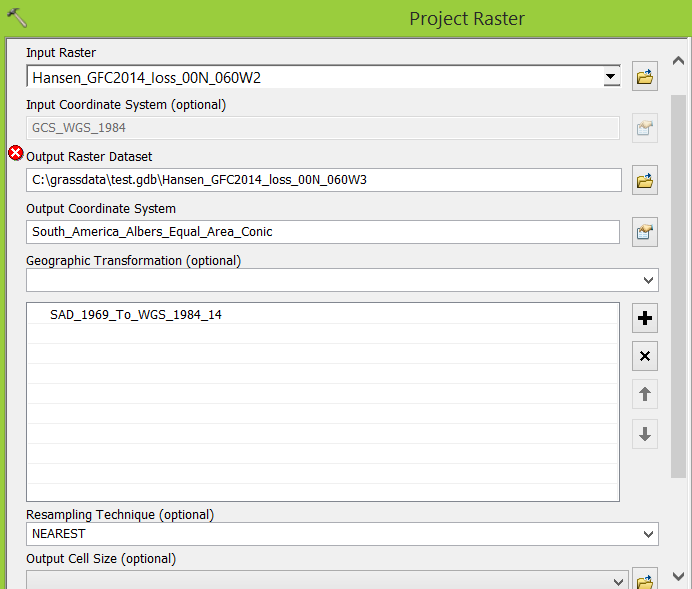
Then I projected it into a generic South American projection:
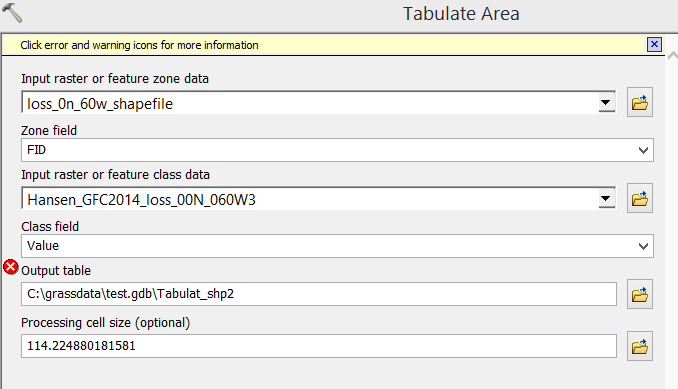
Finally the tabulate area:
Giving me this result:

This is the area of those values, within the overlapping polygon, in square meters, because that is the unit of the coordinate system I picked. You should probably finesse all this if you want to do it right, but this should get you going.
- Mark as New
- Bookmark
- Subscribe
- Mute
- Subscribe to RSS Feed
- Permalink
Thank you very much I cannot begin to explain how helpful this has been. You've made it look easy  I will go through it later as soon as I'm back at my PC. Would it be possible to PM you later? Is that possible here? Otherwise I'll update this thread again with my results.
Cheers!
- Mark as New
- Bookmark
- Subscribe
- Mute
- Subscribe to RSS Feed
- Permalink
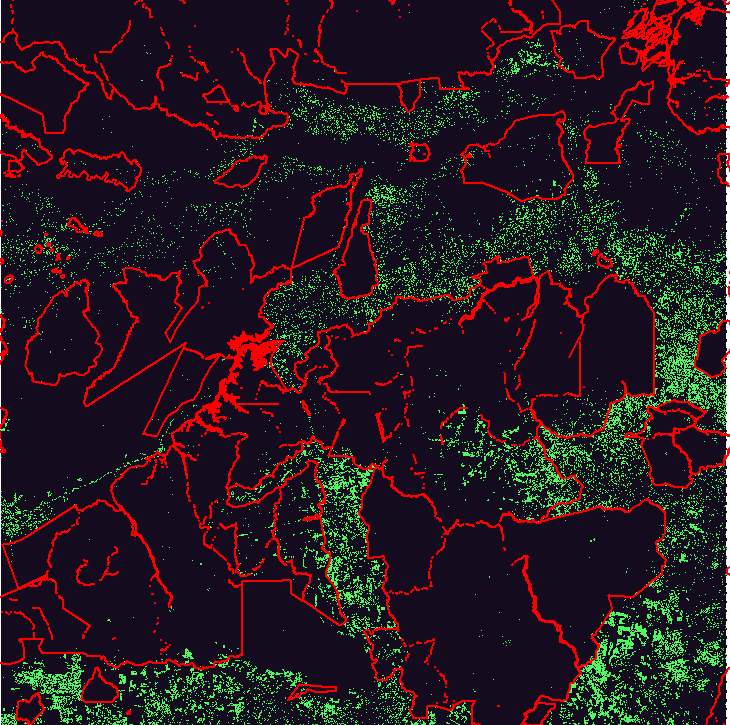
I know! I noticed that immediately, it's so cool I've decided to do a whole project on it