- Home
- :
- All Communities
- :
- Products
- :
- Spatial Data Science
- :
- Spatial Data Science Questions
- :
- Just started using ArcMap - is this kind of analys...
- Subscribe to RSS Feed
- Mark Topic as New
- Mark Topic as Read
- Float this Topic for Current User
- Bookmark
- Subscribe
- Mute
- Printer Friendly Page
Just started using ArcMap - is this kind of analysis possible?
- Mark as New
- Bookmark
- Subscribe
- Mute
- Subscribe to RSS Feed
- Permalink
- Report Inappropriate Content
I have 2 files, a shapefile (.shp) and a raster file (.tif). The .tif is merely 2 bands (0 and 1) where 0 represents no forest loss and 1 represents forest loss (file is from here: http://earthenginepartners.appspot.com/science-2013-global-forest/download_v1.1.html) The .shp consists of polygons that represent protected areas (file is from here: http://www.protectedplanet.net/).
What I'd like to do is try a statistical analysis that would simply tell me how much forest loss ("1" points in the .tif) lies within the protected areas and how much loss lies outside the protected areas (in the .shp).
I'm wondering if it's possible to do this in arcmap/arcgis and if so how would I do this?
Sorry if this seems like a stupid question, I haven't been using the software for long and I couldn't find anything online.
Solved! Go to Solution.
Accepted Solutions
- Mark as New
- Bookmark
- Subscribe
- Mute
- Subscribe to RSS Feed
- Permalink
- Report Inappropriate Content
Sephe Fox:
Get a shapefile for the region, and then run an Identity, using the region as the input, and the protected areas as the identity. This will combine them. You might have to do a dissolve at this point to get just two polygons-inside and outside of protected areas. Then run the same process. This time the tabulate will have two rows--one for each polygon.
It worked! I can't believe it. after all these steps it actually worked. I've done it using peculiar areas that don't mean anything because I was testing so I won't post my data yet, but the process works.
As a TL;DR for anyone else interested the process is:
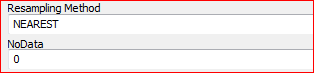
1. Resample (tool) the raster to a manageable size/scale i.e. X+Y values 0.001 and technique as NEAREST.
2. If you need multiple rasters to cover the area of interest use Mosaic to New Raster tool, leave all the optional boxes blank and number of bands should be 1.
3. Project your raster (Project Raster tool) to a system that uses a unit that lets you work out the areas further down the line so meters for example. I think any system that has equal area in the title will do this just make sure it's the correct region for the data.
4. Merge all the protected areas you want to use (for example only designated areas) into one big one that covers your area of interest.
5. Also might be easier to make sure the basemap shapefile for the terrestrial area you're interested is one polygon too.
6. Use the Identity tool and set your basemap shapefile/region as input and the protected area shapefile as identity.
7. This may result in a shapefile with more than 2 polygons, at this point either use the Dissolve tool to merge everything into 2 layers via a field with only 2 different values that correspond to protected and not protected. Or use the editor to manually merge the many polygons into just 2 polygons, make sure you don't mix any up though.
8. Run the Tabulate Area tool with 1st input as the shapefile and 2nd input as the raster. Zone as FID. Class as value. Processing cell size as default. This should give you a table with 2 rows, unprotected and protected areas, for value 0 (i.e no loss) and value 1 (i.e. loss).
I think this is pretty much correct, please let me know if anything is wrong, doesn't make sense or doesn't work.
Thank you Sephe for all your help I wouldn't have gotten this far if it wasn't for you so thanks again for taking the time to help me out.
- Mark as New
- Bookmark
- Subscribe
- Mute
- Subscribe to RSS Feed
- Permalink
- Report Inappropriate Content
He Elio, if you have the spatial analyst extension I would try using the zonal statistics tool: ArcGIS Desktop.
- Mark as New
- Bookmark
- Subscribe
- Mute
- Subscribe to RSS Feed
- Permalink
- Report Inappropriate Content
Just a note that Tabulate Area is a better choice for categorical area analysis because:
a.) it calculates area directly. Zonal Statistics will provide a sum of cells that you will have to calculate to an area later.
b.) it will handle more than one class. Zonal Statistics provides one final statistic per zone (sum, mean, etc.) so unless you are only interested in summing the number of cells with the value 1, this is not a good tool to use. Tabulate Area will provide sums for each class, regardless of it's original value.
- Mark as New
- Bookmark
- Subscribe
- Mute
- Subscribe to RSS Feed
- Permalink
- Report Inappropriate Content
Hi again Darren just wanted to say I got Tabulate Area to work with the help of Sephe so thanks to both of you. This did indeed get the result I was looking for.
- Mark as New
- Bookmark
- Subscribe
- Mute
- Subscribe to RSS Feed
- Permalink
- Report Inappropriate Content
Hi Sephe, I couldn't really understand the output this created I think it's a bit too complex for what I'm trying to achieve, perhaps I did it wrong? I'm just trying to find out how many points lie within protected areas and how many lie outside the protected areas. This translates as "1" data points in the .tif, and polygons in the .shp.
- Mark as New
- Bookmark
- Subscribe
- Mute
- Subscribe to RSS Feed
- Permalink
- Report Inappropriate Content
Tabulate Area will give you the areas of 0 and 1 inside your shapefile.
You will have to define what is "outside". If it's your whole raster, just calculate the total areas of 0 and 1 and subtract those inside. If some other area for "outside", draw a polygon and use Tabulate Area.
- Mark as New
- Bookmark
- Subscribe
- Mute
- Subscribe to RSS Feed
- Permalink
- Report Inappropriate Content
Darren,
I think OUTSIDE means the part of the Forest Loss area in Raster that lies outside the protected area polygon.
__________________________________________________________________________________
Elio,
Apart from the above suggestions bu Sephe and Darren, you could also try Raster to Polygon to convert the raster to polygon. Also go to Environment Settings > Raster Storage. Define NoData value as 0. (This will ensure that no polygon is created out of No Forest area.)
Now you have polygon feature (shapefile) of Forest Loss area
Then use Union between the two shapefiles. In the resulting shapefile, use Select by Attributes and Statistics (attribute table) to identify the total area of Forest Loss inside /outside protected area.
Think Location
- Mark as New
- Bookmark
- Subscribe
- Mute
- Subscribe to RSS Feed
- Permalink
- Report Inappropriate Content
Hi Jayanta I liked the look of this approach but I couldn't get it to work, my resulting attribute table after the union is a mess and looks completely wrong haha. I I will give it another try tomorrow, I think merging the polygons in each layer first might help. Perhaps you could try running the sequence yourself using the same data
http://www.protectedplanet.net/downloads/WDPA_June2015?type=shapefile (I just created a new shapefile using the polygons that cover the .tif to reduce file size)
Is this the easiest way to find out how many points lie within protected areas and how many lie outside the protected areas?
Thanks for your help.
- Mark as New
- Bookmark
- Subscribe
- Mute
- Subscribe to RSS Feed
- Permalink
- Report Inappropriate Content
Oh Elio, could you not upload a subset of the shapefile? Nobody is super keen to download a 2GB shapefile.
- Mark as New
- Bookmark
- Subscribe
- Mute
- Subscribe to RSS Feed
- Permalink
- Report Inappropriate Content
Select the polygons you're interested in, right click the shapefile in the table of contents and select export. Save the shapefile, then zip all the individual files with that name (they are all parts of the same shapefile) and zip it up. Then you can attach the zip in a comment here.