- Home
- :
- All Communities
- :
- Products
- :
- Spatial Data Science
- :
- Spatial Data Science Questions
- :
- Re: how to compute points whose location is simult...
- Subscribe to RSS Feed
- Mark Topic as New
- Mark Topic as Read
- Float this Topic for Current User
- Bookmark
- Subscribe
- Mute
- Printer Friendly Page
how to compute points whose location is simultaneously the two polygons.
- Mark as New
- Bookmark
- Subscribe
- Mute
- Subscribe to RSS Feed
- Permalink
The question is relatively simple, but I'm stuck in the alley's been two!
I have a shape with five concentric buffers would like to compute the number of points (need to know who these points later) for each buffer layer.
I could not solve this a "smart" way, so I thought it's just me compute in a spreadsheet since most buffer layer would be made up of their unique values + the values of the other lower layers. Solved the problem !!!!!!!!!
It did not work because I have buffers overlap with each other. I am making these buffer for all capitals of the world, the circle area, overcomes the limitations of other buffer
This happens in ArcGIS because he attributed the data to the closest point to the polygon.
Problem Summary: how to compute points whose location is simultaneously the two polygons.
thank you !!!
Solved! Go to Solution.
Accepted Solutions
- Mark as New
- Bookmark
- Subscribe
- Mute
- Subscribe to RSS Feed
- Permalink
Spatial Join is the correct tool to use. With this tool you have two choices for how you can summarize your data. For both you would make the points the target and the buffers the join features.
1. If you use the One-To-Many Option then points will be duplicated whenever they fall within more than one buffer. This is useful if you want to do your own summaries later on the PointID. However, difficulties will arise if you want to see the point set groupings of buffer values for more than 2 overlapping buffers and you cannot symbolize a One-To-Many relationship on a map. But it is able to get counts by each buffer easily.
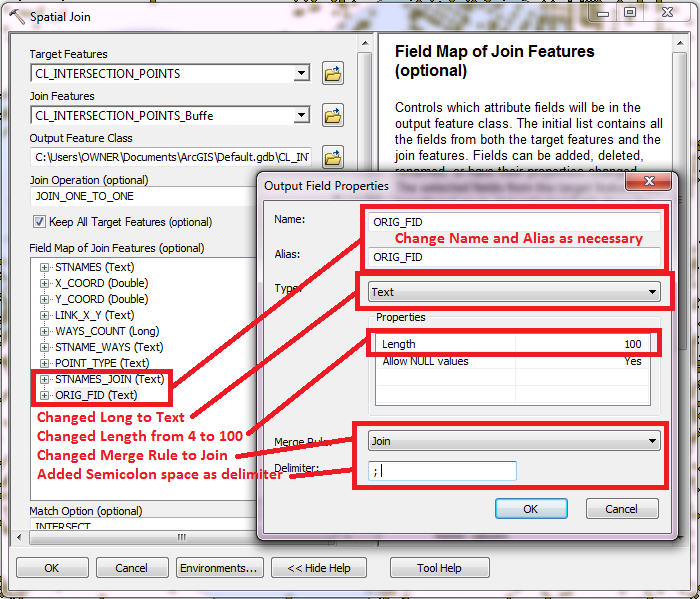
2. Alternatively, you can use the One-To-One option to maintain the same number of output points as there were input points. To get a summary that accounts for all of the buffers touched you would adjusted the field containing the polygon name to use the JOIN merge option with a semicolon delimiter and make that field into a text field (if it wan't already) with enough characters to hold the full list of all the buffers that touched the points. Only one point would be created for each input point, but the points that fall within more than one buffer would contain a list of buffers instead of just one buffer. Here is an example Join rule setup I did with my own data:
The Original Data:
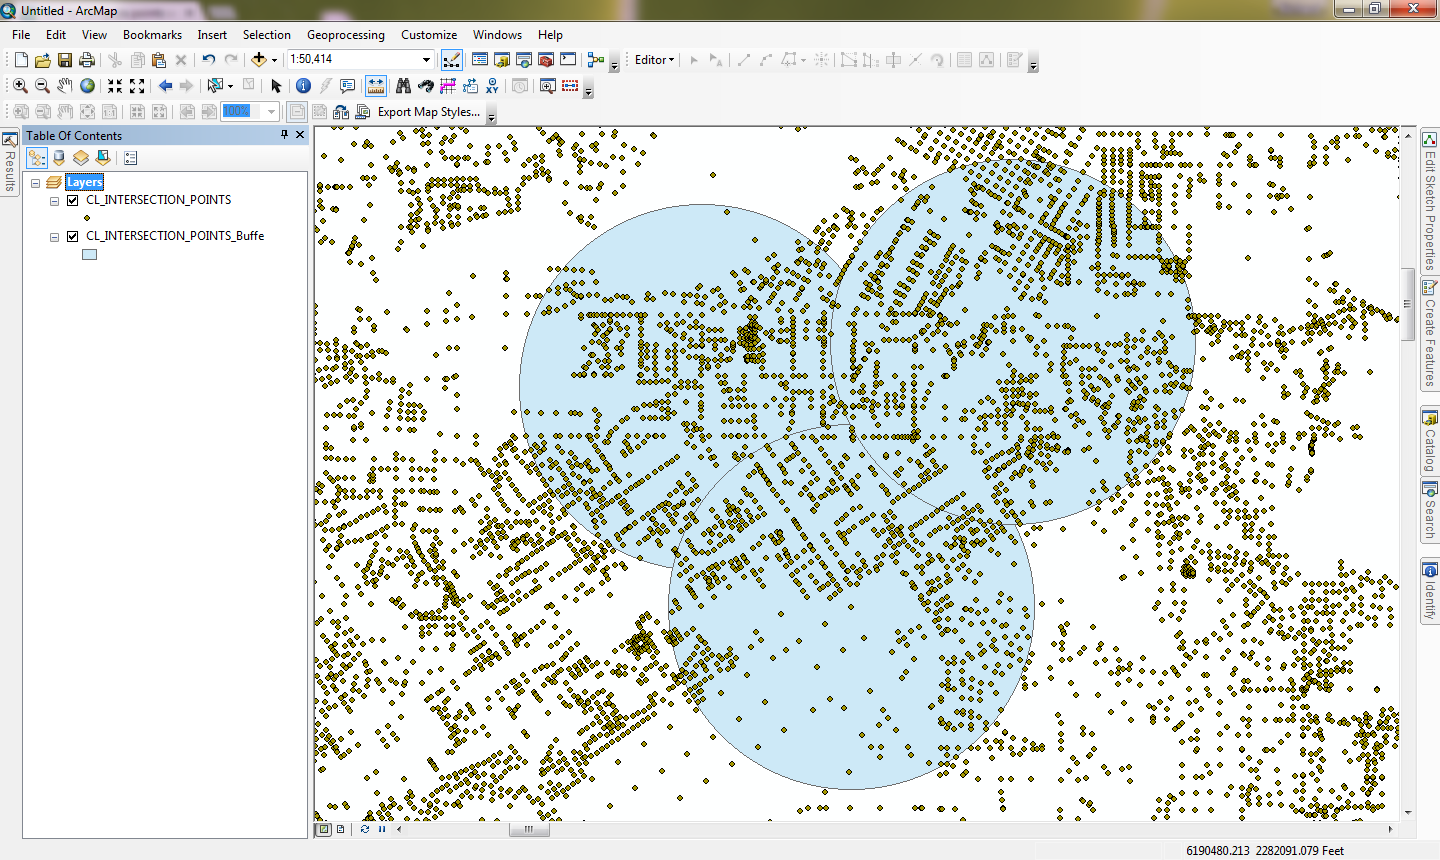
Right click your summary field where you want a joined list and click Property to bring up the Output Field Property dialog. Here is my set up of a field to create a Join list output (I set up 2 of them, but just show the result for ORIG_FID in the pictures below).
For your list above these settings would result in 3 points which would have field values as shown below:
Pt1 PolygonA; PolygonB
Pt2 PolygonA; PolygonB; PolygonC
Pt3 PolygonB; PolygonA
The One-To-One option is most useful for symbology, since you can only symbolize One-to-One data easily and you could make symbols for each unique set of list values. The lists may not always come out in numeric or alphabetical order, so you might have to group the PolygonA; PolygonB and PolygonB; PolygonA lists together or post process one of those two lists to standardize it to a single listing order.
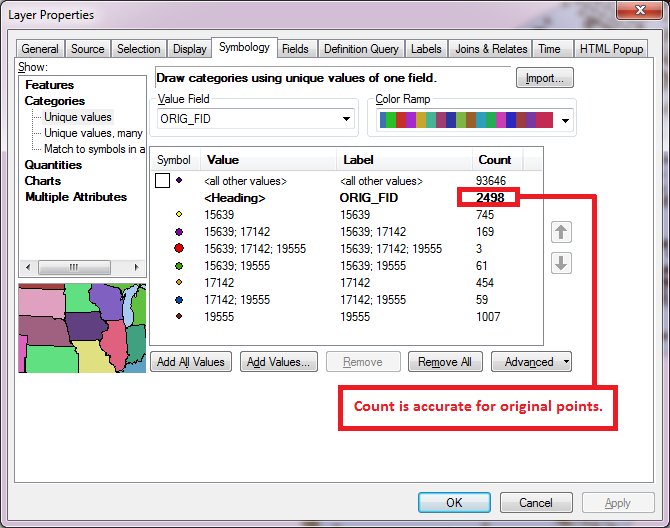
For my data the list order came out standardized already. Here was the unique list of values that were joined to my points and how I symbolized them (Note that the count is the same as if I had selected the original points that fell in these buffers):
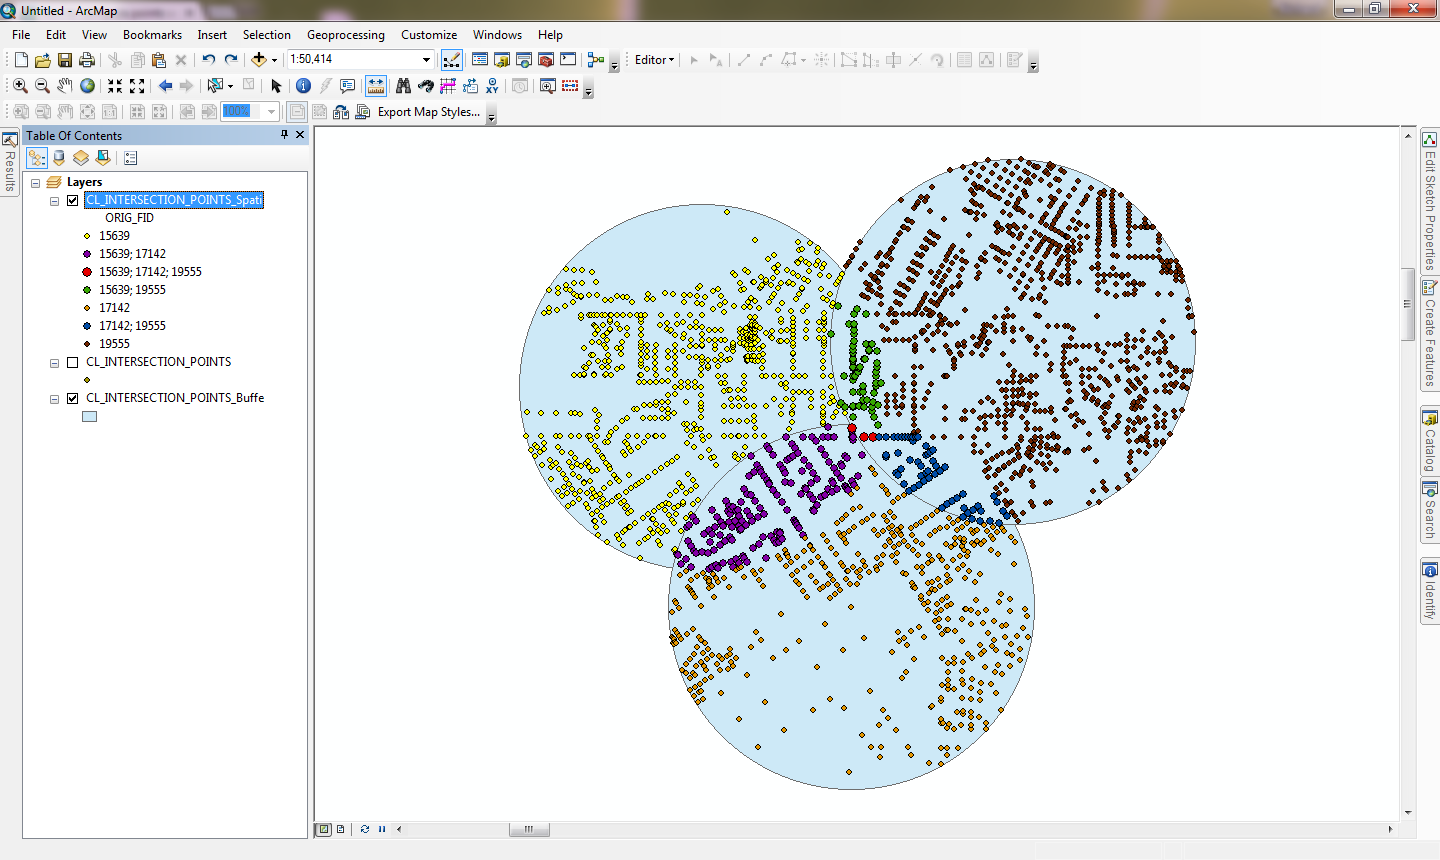
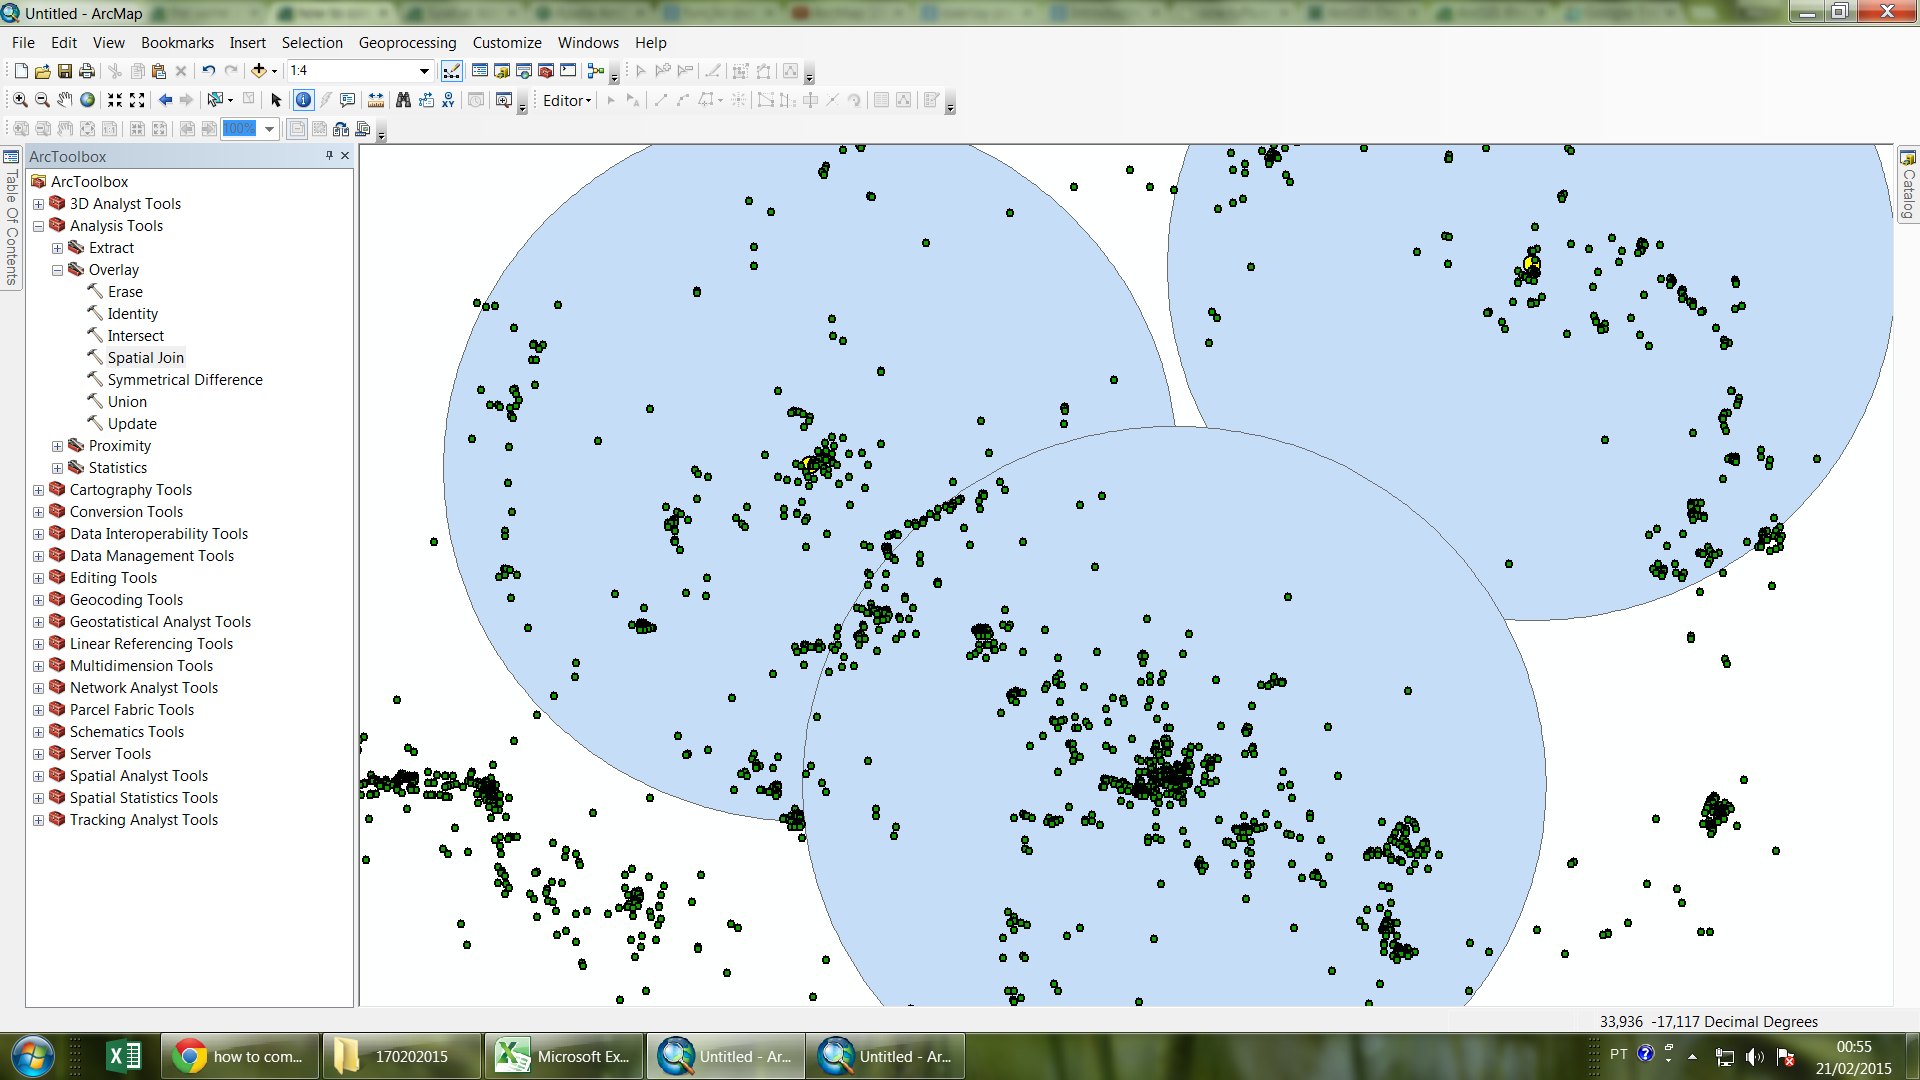
Here is the resulting map showing the symbols above:
The disadvantage of the One-To-One list option is that the Join Lists make it difficult to get the full point count for each individual buffer (each full buffer is split into 4 different lists that might have to be manually selected as a set for one buffer at a time using Select by Location for each buffer or using a Select By Attributes query with Like SQL statements to see the full point count of each whole buffer), so you may want to do both Spatial Joins to do different analysis summaries and outputs.
- Mark as New
- Bookmark
- Subscribe
- Mute
- Subscribe to RSS Feed
- Permalink
to become more easy to understand ..
we note that many of the points "fall" in different polygons!
I needed a table that shows up this data
example:
Pt1 PolygonA
Pt1 PolygonB
Pt2 PolygonA
Pt2 PolygonB
Pt2 PolygonC
Pt3 PolygonB
Pt3 PolygonA
polygons = cities
point = species
- Mark as New
- Bookmark
- Subscribe
- Mute
- Subscribe to RSS Feed
- Permalink
The way I used was:
Analyses -> overlay -> join space -> I used the many option
Do you think this correct?
Have you used this tool?
apparently worked, but I'm afraid to be wrong computing!
thanks
- Mark as New
- Bookmark
- Subscribe
- Mute
- Subscribe to RSS Feed
- Permalink
No problem at all...
Spatial Join (One-to-Many) would give you the same answer as Identity.
All the best.
Thanks,
Jay
Think Location
- Mark as New
- Bookmark
- Subscribe
- Mute
- Subscribe to RSS Feed
- Permalink
Spatial Join is the correct tool to use. With this tool you have two choices for how you can summarize your data. For both you would make the points the target and the buffers the join features.
1. If you use the One-To-Many Option then points will be duplicated whenever they fall within more than one buffer. This is useful if you want to do your own summaries later on the PointID. However, difficulties will arise if you want to see the point set groupings of buffer values for more than 2 overlapping buffers and you cannot symbolize a One-To-Many relationship on a map. But it is able to get counts by each buffer easily.
2. Alternatively, you can use the One-To-One option to maintain the same number of output points as there were input points. To get a summary that accounts for all of the buffers touched you would adjusted the field containing the polygon name to use the JOIN merge option with a semicolon delimiter and make that field into a text field (if it wan't already) with enough characters to hold the full list of all the buffers that touched the points. Only one point would be created for each input point, but the points that fall within more than one buffer would contain a list of buffers instead of just one buffer. Here is an example Join rule setup I did with my own data:
The Original Data:
Right click your summary field where you want a joined list and click Property to bring up the Output Field Property dialog. Here is my set up of a field to create a Join list output (I set up 2 of them, but just show the result for ORIG_FID in the pictures below).
For your list above these settings would result in 3 points which would have field values as shown below:
Pt1 PolygonA; PolygonB
Pt2 PolygonA; PolygonB; PolygonC
Pt3 PolygonB; PolygonA
The One-To-One option is most useful for symbology, since you can only symbolize One-to-One data easily and you could make symbols for each unique set of list values. The lists may not always come out in numeric or alphabetical order, so you might have to group the PolygonA; PolygonB and PolygonB; PolygonA lists together or post process one of those two lists to standardize it to a single listing order.
For my data the list order came out standardized already. Here was the unique list of values that were joined to my points and how I symbolized them (Note that the count is the same as if I had selected the original points that fell in these buffers):
Here is the resulting map showing the symbols above:
The disadvantage of the One-To-One list option is that the Join Lists make it difficult to get the full point count for each individual buffer (each full buffer is split into 4 different lists that might have to be manually selected as a set for one buffer at a time using Select by Location for each buffer or using a Select By Attributes query with Like SQL statements to see the full point count of each whole buffer), so you may want to do both Spatial Joins to do different analysis summaries and outputs.
- Mark as New
- Bookmark
- Subscribe
- Mute
- Subscribe to RSS Feed
- Permalink
Hello Thank you all for helping me!
Richard
You really saved my life! For your explanation I could understand the limitations and benefits of each method of "Spatial Join".
You were right, with "many" I was with monstrous size tables. But I worked with her in "R", this because the other method "one to one" leaves the table with the number of very large columns. I use 10 concentric buffers and with much overlap.
Again, I do not know how to put into words how much you helped me!