- Home
- :
- All Communities
- :
- Products
- :
- Spatial Data Science
- :
- Spatial Data Science Questions
- :
- Re: Group every near 50 points together
- Subscribe to RSS Feed
- Mark Topic as New
- Mark Topic as Read
- Float this Topic for Current User
- Bookmark
- Subscribe
- Mute
- Printer Friendly Page
- Mark as New
- Bookmark
- Subscribe
- Mute
- Subscribe to RSS Feed
- Permalink
Hi All,
I have a point FC I want to group every near 50 points together.
I tried:
1-Near tool or generate near table tool but the overlap is a big problem.
2-Grouping analysis tool with K-means but the number of points within each group is varying depending on the spatial location.
what I want is every near 50 point together in one group and only one group might be less than 50 points.
I understand it might look something like this (restrict 50 point group)
Thanks,
Solved! Go to Solution.
Accepted Solutions
- Mark as New
- Bookmark
- Subscribe
- Mute
- Subscribe to RSS Feed
- Permalink
There is a general solution of using the nifty generalized spatial sort available from the Sort tool (requires Advanced license).
Then, in the sorted point table put them into groups with the python expression
int(OBJECTID / 50) # geodatabase (OIDs start with 1)
int((OBJECTID + 1) / 50) # shape (OIDs start with 0)Whether the results are really what you want (as Dan points out) is another question.
- Mark as New
- Bookmark
- Subscribe
- Mute
- Subscribe to RSS Feed
- Permalink
Showing your point pattern might be better. Perhaps it isn't possible given your restriction and your data
- Mark as New
- Bookmark
- Subscribe
- Mute
- Subscribe to RSS Feed
- Permalink
I am thinking maybe if I can do some equation on the variance of the coordinates.
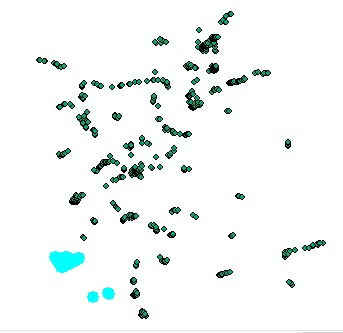
EX: I sort the longitude column and add other column "RANK_X" holding sequence from 1 to the last row then I did the same for the Latitude adding "RANK_Y" column, and by summing those two rank columns "SUM_COORD" I have a number that indicates the variance in coordinates if I sorted this column the first 50 suppose to be near to each other based on the variance of the coordinates.
However, it's not the best approach and not giving the needed result in all the cases. see example below:
Case1:
Case2: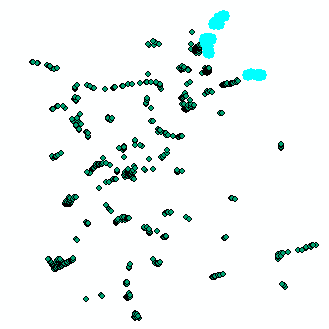
do you think I might get something from this approach maybe enhance the result by adding something to the equation?
- Mark as New
- Bookmark
- Subscribe
- Mute
- Subscribe to RSS Feed
- Permalink
I see a few of cases, some of which you have highlighted, where the points are indeed clustered and could form or be used to form, aggregated units. I see far more cases where the linearity of the pattern is going to make meaningful clusters difficult... particularly if you are using a threshold of 50 points.
- So why 50 points? this hasn't been explained?
- These pints appear to be events collected along a linear network (road? perhaps?)
- What is the goal/purpose of the clustering?
Answers to these questions may provide more meaningful suggestions. Sorting by longitude and latitude is not going to yield much in the way of useful information. A 'minimum spanning tree' will provide connections that minimize the aggregated distance connecting the points, but this will be of little use if the points are indeed collected along a linear network.
- Mark as New
- Bookmark
- Subscribe
- Mute
- Subscribe to RSS Feed
- Permalink
There is a general solution of using the nifty generalized spatial sort available from the Sort tool (requires Advanced license).
Then, in the sorted point table put them into groups with the python expression
int(OBJECTID / 50) # geodatabase (OIDs start with 1)
int((OBJECTID + 1) / 50) # shape (OIDs start with 0)Whether the results are really what you want (as Dan points out) is another question.
- Mark as New
- Bookmark
- Subscribe
- Mute
- Subscribe to RSS Feed
- Permalink
I would go for the solution provided by Curtis Price . Just did a simple test with some random points and when you use the PEANO option for spatial sort it kinda makes sense...

Resulted in:
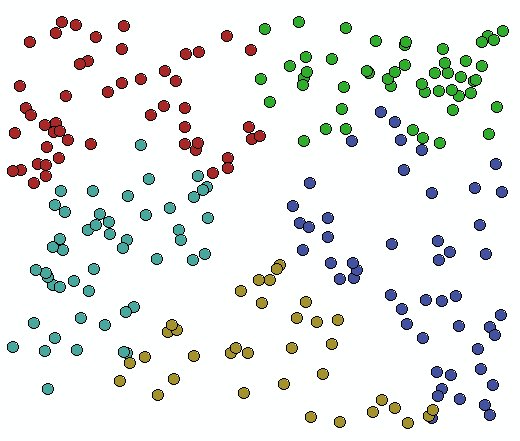
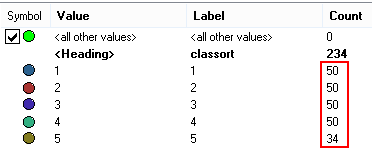
I did change the formula into:
int((!OBJECTID!-1) / 50) +1... to get the appropriate distribution of the clases in a file geodatabase:
- Mark as New
- Bookmark
- Subscribe
- Mute
- Subscribe to RSS Feed
- Permalink
Which still begs the question as to what type of 'distance' is needed. The point locations look far from random and I suspect they are observations 'along' something which makes shortest/closest a whole different issue
- Mark as New
- Bookmark
- Subscribe
- Mute
- Subscribe to RSS Feed
- Permalink
Thank you, Dan
The points indeed are events collected along street network.
50 point is a must as this is the main purpose or request.
- Mark as New
- Bookmark
- Subscribe
- Mute
- Subscribe to RSS Feed
- Permalink
let me describe it like this each 50 location will be photographed by a drone,
each drone could only take 50 photos, no matter what is the distance to be crossed.
this is not the real case but it's something similar to this.
Thank you all for your answers and comments.
- Mark as New
- Bookmark
- Subscribe
- Mute
- Subscribe to RSS Feed
- Permalink
Makes sense in that context... I just wanted to make sure that the use wasn't the shortest distance... only to find out that method of transport was via road. Drone is good  . I would go with the suggestions of the peano search as curtvprice and demonstrated by xander_bakker