Turn on suggestions
Auto-suggest helps you quickly narrow down your search results by suggesting possible matches as you type.
Cancel
Spatial Data Science Blog - Page 2
Turn on suggestions
Auto-suggest helps you quickly narrow down your search results by suggesting possible matches as you type.
- Home
- :
- All Communities
- :
- Products
- :
- Spatial Data Science
- :
- Spatial Data Science Blog
- :
- Spatial Data Science Blog - Page 2
Options
- Mark all as New
- Mark all as Read
- Float this item to the top
- Subscribe to This Board
- Bookmark
- Subscribe to RSS Feed
Subscribe to This Board
Latest Activity
(13 Posts)
Esri Contributor
12-16-2016
10:04 AM
1
0
3,241
Esri Contributor
08-26-2016
02:02 PM
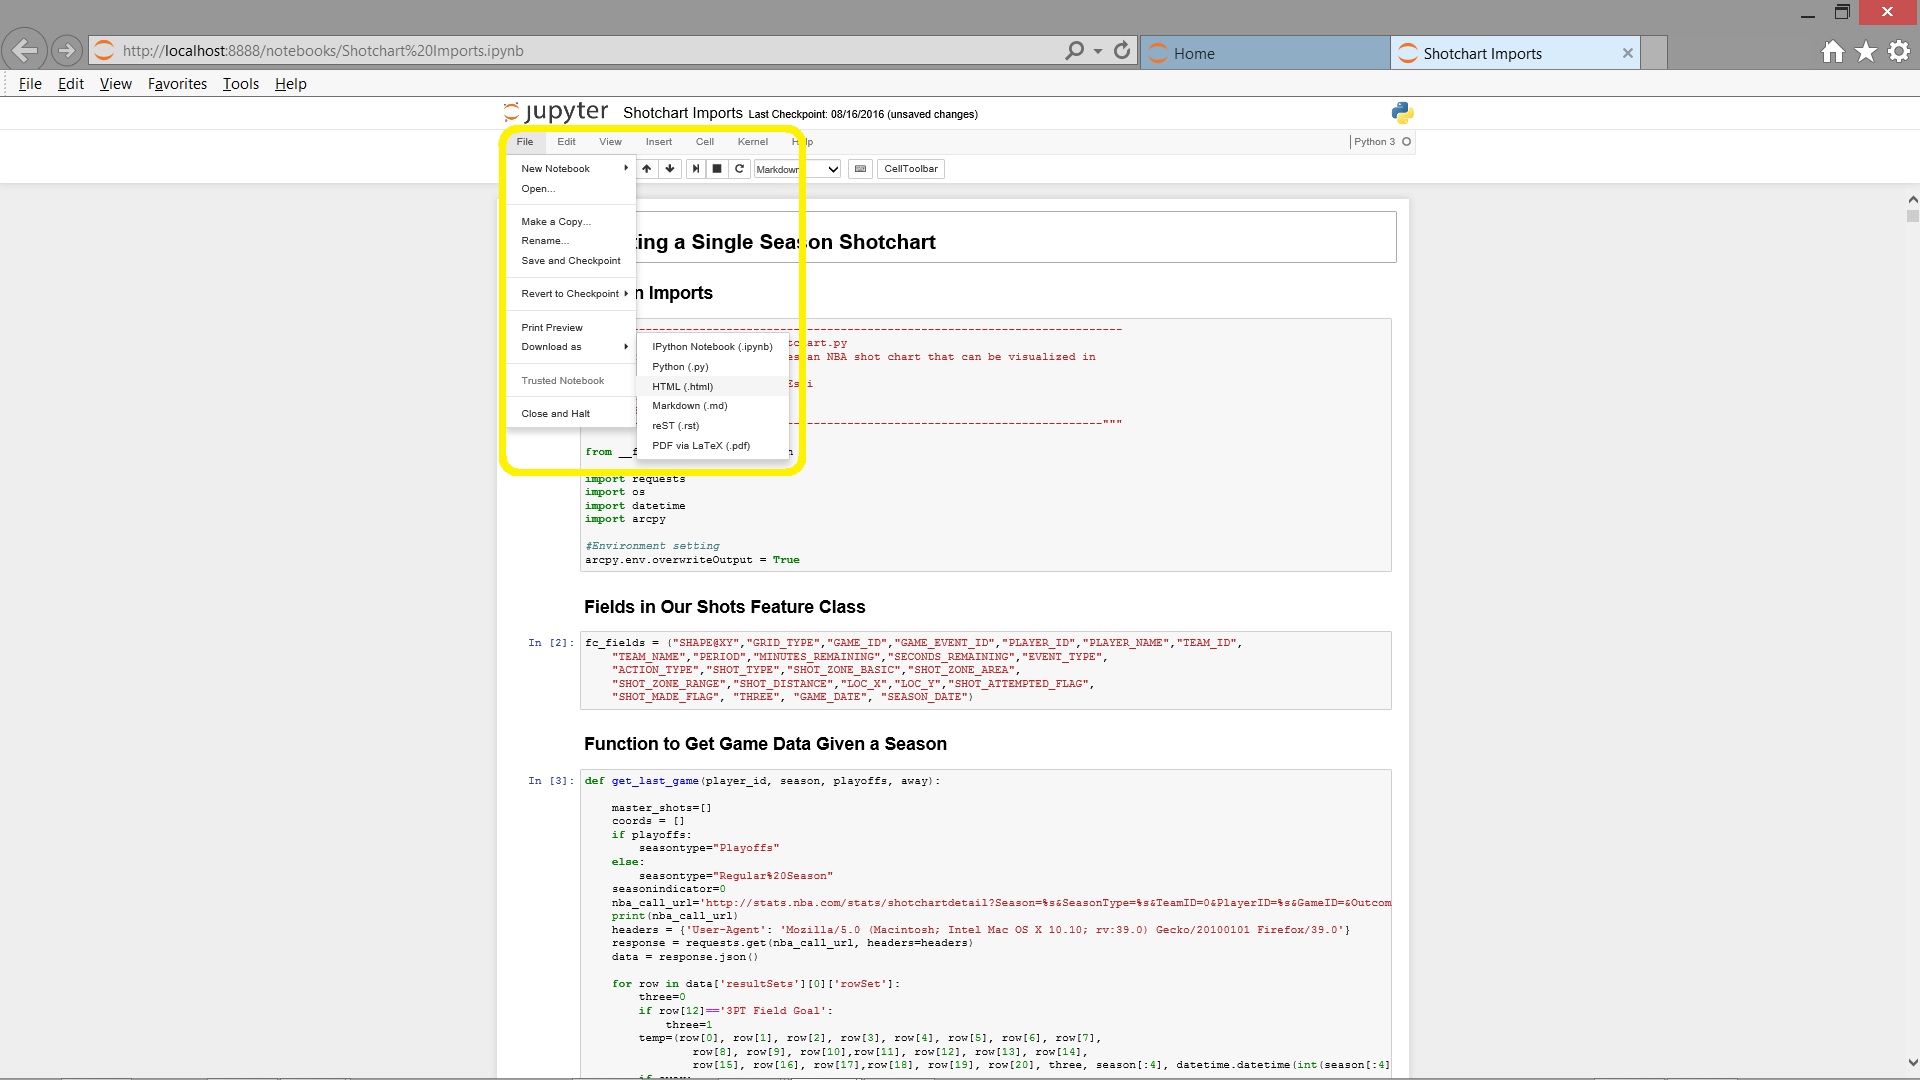
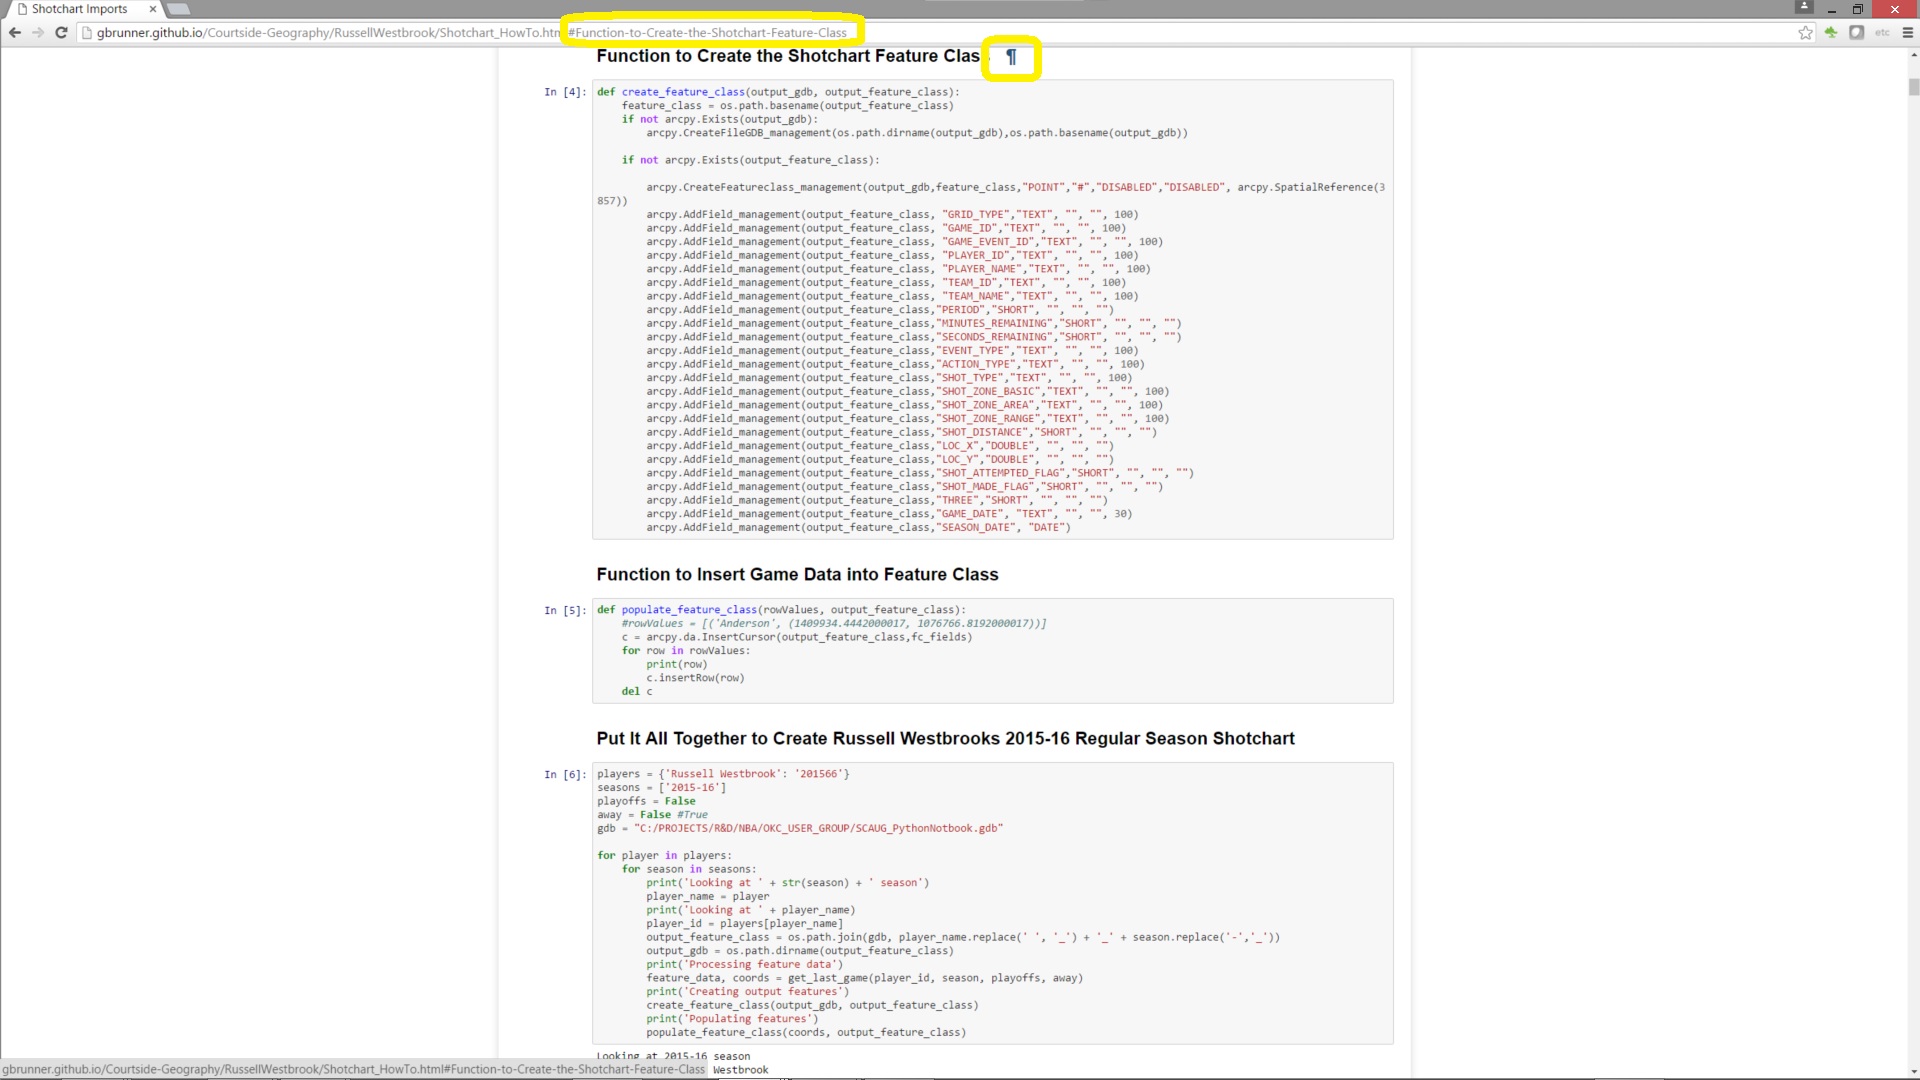 Here, I've highlighted the tag that corresponds to a certain section in my notebook.
6
1
3,783
Esri Contributor
02-22-2016
08:09 AM
3
0
5,830
130 Subscribers
Popular Articles
Data Storytelling: Using Python Notebooks in Story Maps
GregoryBrunner
Esri Contributor
6 Kudos
1 Comments
Using the R-ArcGIS Bridge in Jupyter
GregoryBrunner
Esri Contributor
5 Kudos
1 Comments
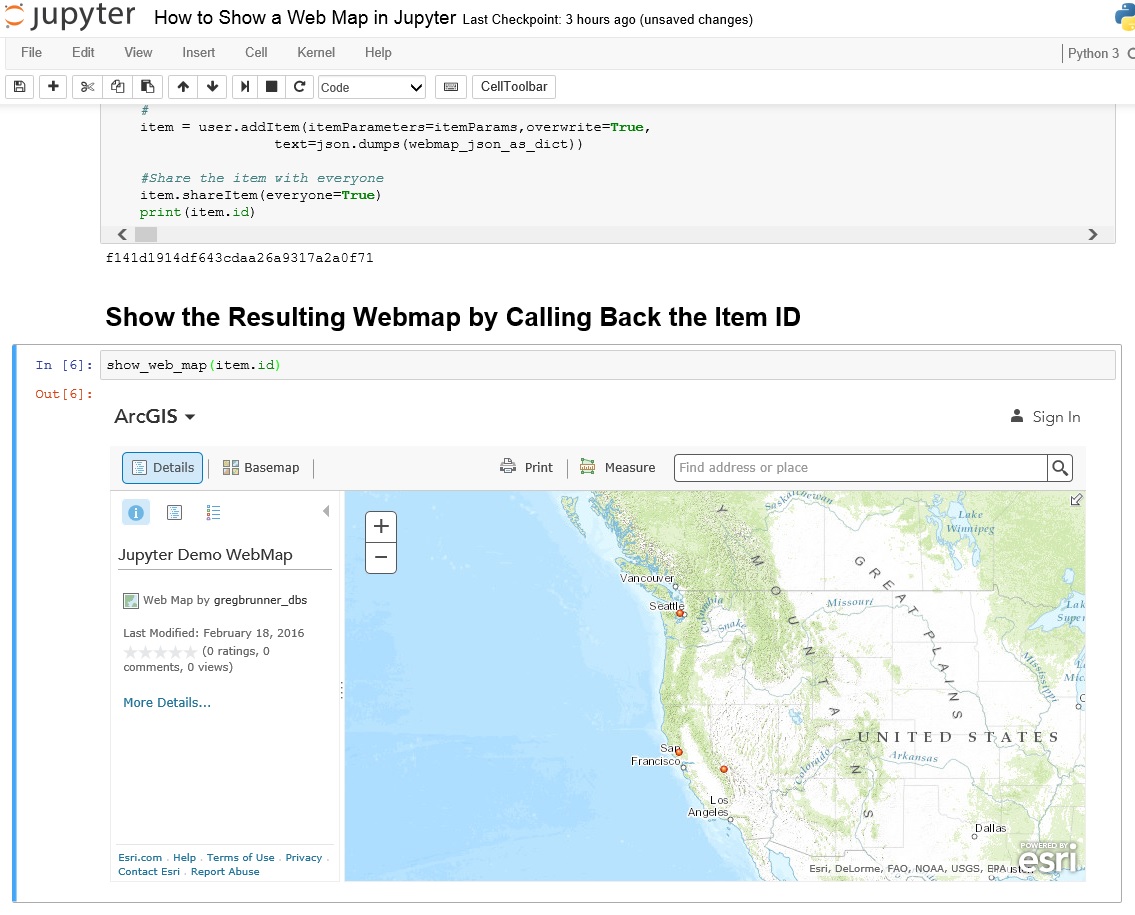
Creating and Displaying Webmaps in Jupyter
GregoryBrunner
Esri Contributor
3 Kudos
0 Comments