- Home
- :
- All Communities
- :
- Developers
- :
- Python
- :
- Python Questions
- :
- Re: Zonal Statistics as Table issue
- Subscribe to RSS Feed
- Mark Topic as New
- Mark Topic as Read
- Float this Topic for Current User
- Bookmark
- Subscribe
- Mute
- Printer Friendly Page
Zonal Statistics as Table issue
- Mark as New
- Bookmark
- Subscribe
- Mute
- Subscribe to RSS Feed
- Permalink
Hi,
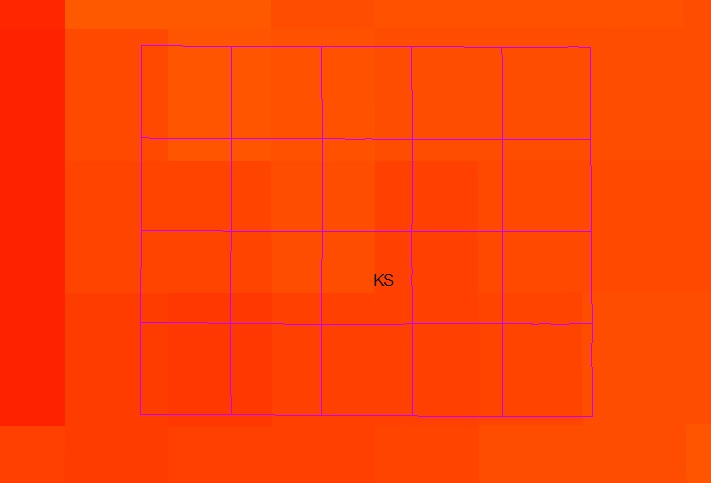
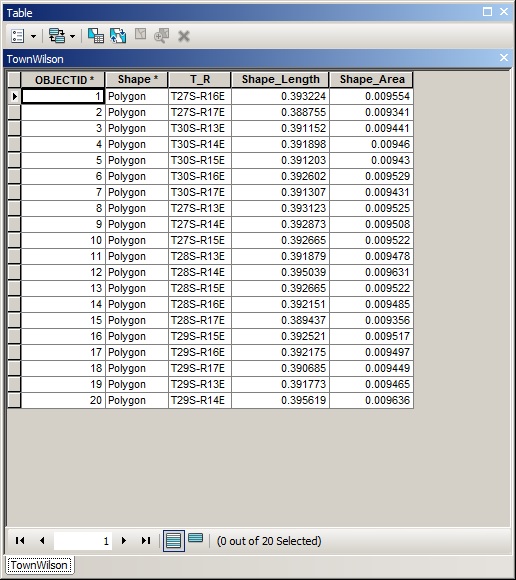
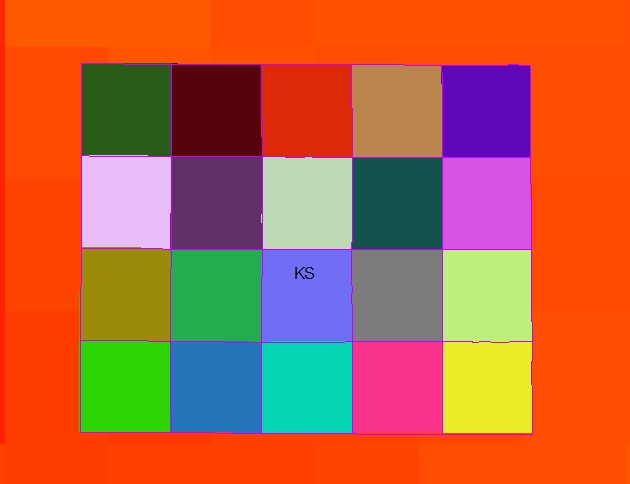
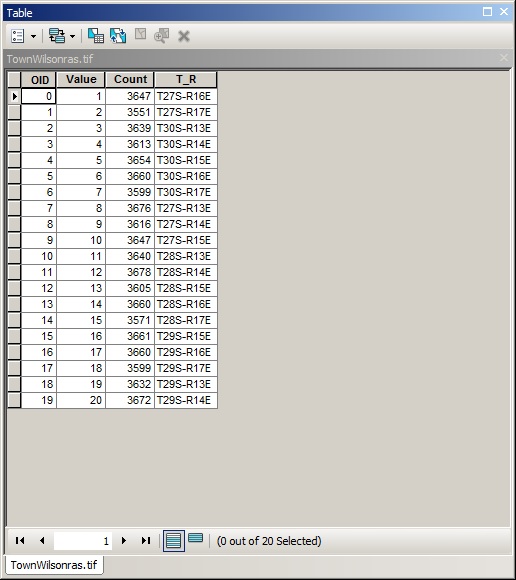
I need to estimate zonal statistics (MEAN) using the "Zonal Statistics as Table" tool in ArcGIS. I have the underlying raster in color (see the image below) and the polygon (grid, TownWilson) in pink color. As you can see, there are 20 grids in the TownWilson grid (shapefile). The grid IDs (T_R) are shown in the table below.
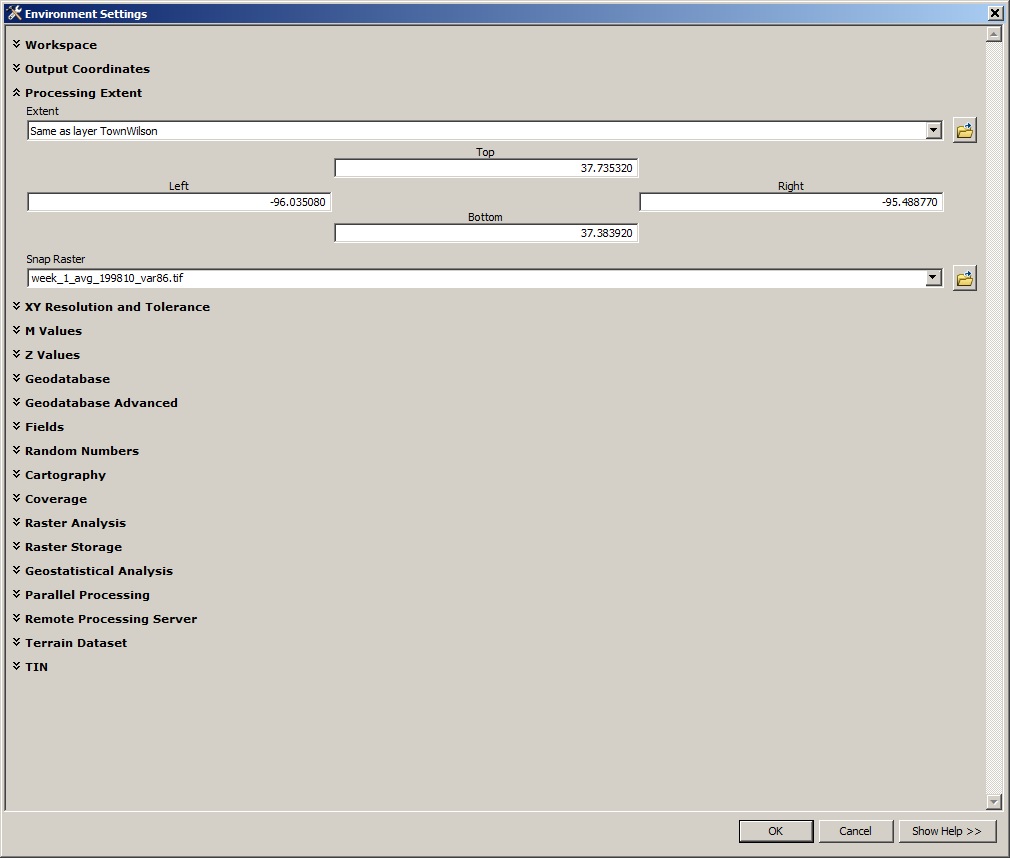
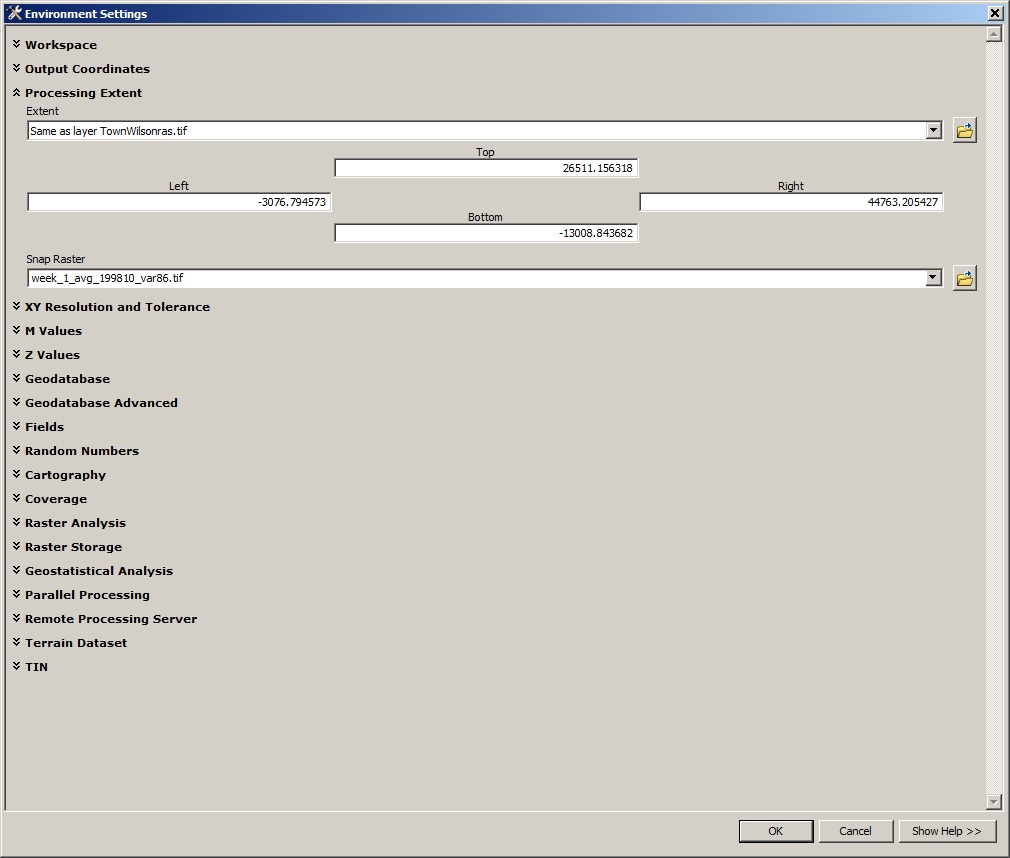
"Zonal Statistics as Table" tool and set up the environment variables as shown below.
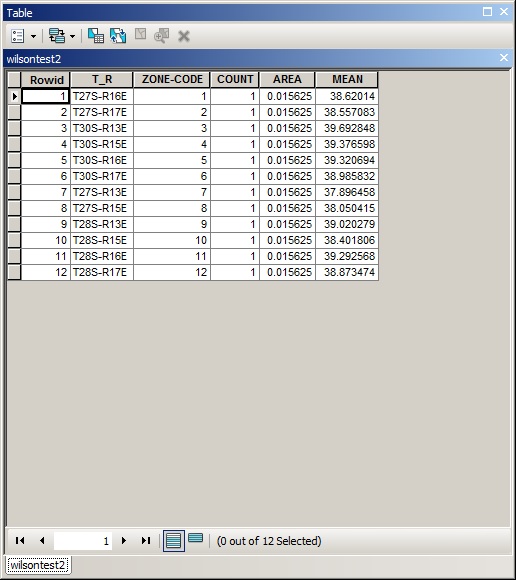
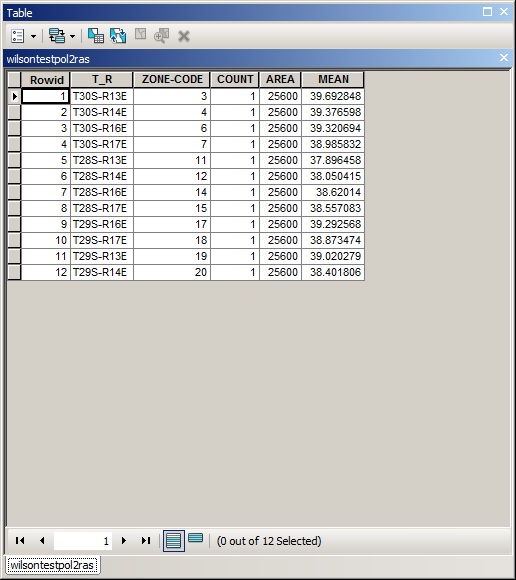
The output table and after the Zonal Statistics as Table run is complete is as follows. It shows zonal mean statistics for ONLY 12 grid IDs (T_R) out of 20 grid IDs in the original TownWilson table above.
Can somebody help me to obtain the statistics for all the T_R IDs in the grid? I cant understand what I am doing wrong here.
Thanks in advance for help.
- Mark as New
- Bookmark
- Subscribe
- Mute
- Subscribe to RSS Feed
- Permalink
Can you convert the polygons to raster using the same setting you applied in the Zonal Statistics as Table tool and post a screenshot of the result?
This will allow us to see how the data in converted and if all 20 polygons are conserved. Internally ArcGIS will convert your polygons to raster and then perform zonal statistics using the two rasters. If the raster contains all the polygons, you can use this raster in the Zonal Statistics as Table Tool.
- Mark as New
- Bookmark
- Subscribe
- Mute
- Subscribe to RSS Feed
- Permalink
Xander,
Thanks again for your input. I have converted the polygon to raster and please see the image below. Polygon raster contains all the T_R IDs. (See the table).
As a test, I have used the polygon raster as shown above and did the Zonal Statistics as Table but still it contains only less number of T_R IDs. (Please see the image below).
Any idea why still its happening?
Thanks.
- Mark as New
- Bookmark
- Subscribe
- Mute
- Subscribe to RSS Feed
- Permalink
What were your analysis extent properties set to from within the Environments Tab (raster properties and Extent) before you ran the tool? Things should be set within the Environments tab of any arctoolbox tool to ensure that they are indeed honored by the tool. And to be sure, that there are no multipart shapes within the feature class? (ie they are all unique)
- Mark as New
- Bookmark
- Subscribe
- Mute
- Subscribe to RSS Feed
- Permalink
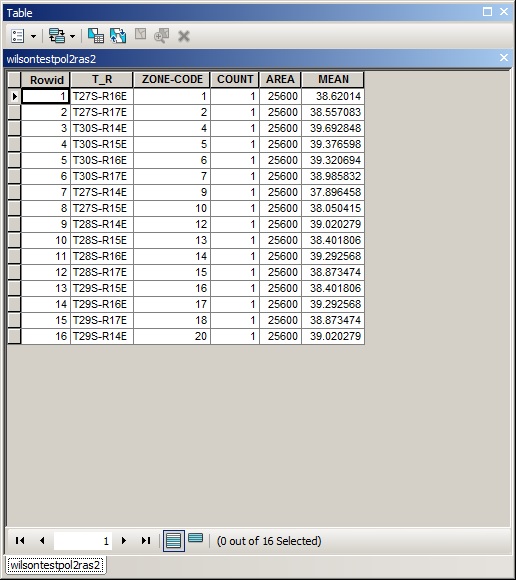
Thanks Dan for the input. I had some luck but not 100%. As you suggested, I set the environment variables, as follows in the image below. Extent as the polygon raster layer and snap raster as my soil moisture raster layer. (See image below). I got 16 T_R IDs (Zonal mean) values with setting up the environment variable. (See the table below for the values for 16 T_R IDs).
Any idea why not values for all T_R IDs even after setting the environment variables?
Thanks gain.
- Mark as New
- Bookmark
- Subscribe
- Mute
- Subscribe to RSS Feed
- Permalink
help us out... show the ones that are missing... a screen grab would make things more or less obvious
- Mark as New
- Bookmark
- Subscribe
- Mute
- Subscribe to RSS Feed
- Permalink
Dan,
The missing grids are shown in Black color in the image below.

- Mark as New
- Bookmark
- Subscribe
- Mute
- Subscribe to RSS Feed
- Permalink
that still looks like an extent issue, in order to check you would need to examine the coordinate positions using your cursor versus those reported by your extent settings. Again, that is assuming that they are unique records with unique values in the original table, since converting to raster will consolidate what were 4 records in a featureclass table to 1 zone in a raster
- Mark as New
- Bookmark
- Subscribe
- Mute
- Subscribe to RSS Feed
- Permalink
Thanks. Dan. I did not quite understand what you mentioned above. In fact, I have converted the polygon raster file to the same projection as with the soil moisture raster. I ran the "Zonal Statistics as Table" tool but still it did not solve the problem. I am kind of frustrated why this is not working.
- Mark as New
- Bookmark
- Subscribe
- Mute
- Subscribe to RSS Feed
- Permalink
Hi Dumindu Jayasekera ,
Perhaps some pointers are in place here. Normally when you perform analysis with raster data, it is recommended that all raster share the same coordinate system, extent and resolution (cell size) in order to make sure that the cells align. Also the cell size that you select for your analysis should be chosen wisely in order to get results you can use. What I have seen from your screenshots is that you are performing an analysis using rasters that do not share the same pixel size and cells do not align which may lead to unexpected results. I think that is exactly what is happening here. If you really want to determine statistically how the polygons overlap the raster data, you would want to increment the precision and reduce the cell size. This way you will be able to determine parts of raster cells that cover each polygon and statistical operations would be meaningful, since if you have a single pixel, min, max, mean, sum will all be the same...
If you can share the data and attach it to the thread, I can show you what I mean and investigate what other possible reasons you may have for the operation to yield incorrect or unexpected results.