- Home
- :
- All Communities
- :
- Developers
- :
- Python
- :
- Python Questions
- :
- Re: Would like to create star and snowflake symbol...
- Subscribe to RSS Feed
- Mark Topic as New
- Mark Topic as Read
- Float this Topic for Current User
- Bookmark
- Subscribe
- Mute
- Printer Friendly Page
Would like to create star and snowflake symbols
- Mark as New
- Bookmark
- Subscribe
- Mute
- Subscribe to RSS Feed
- Permalink
I am trying to replicate a technique used in the attached photo which uses what they call, "star and snowflake symbols" for multivariate analysis. Is there any functionality in Desktop that might accomplish this or a similar visualization?
Source: Slocum, T. A., McMaster, R. B., Kessler, F. C. and Howard, H. H. 2005. Thematic Cartography and Geographic Visualization, Prentice‐Hall. 2nd edition (p. 355)
Solved! Go to Solution.
Accepted Solutions
- Mark as New
- Bookmark
- Subscribe
- Mute
- Subscribe to RSS Feed
- Permalink
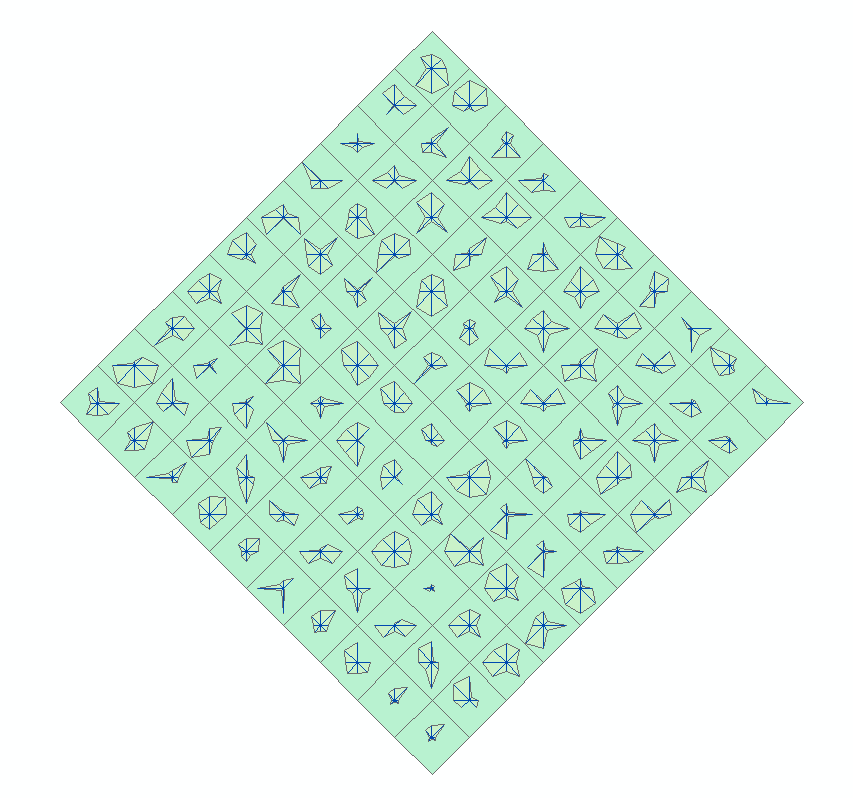
Here's how you can do it with arcpy geometries (10.1+):
>>> fc = "grid" # input feature layer
... sr = arcpy.Describe(fc).spatialReference # spatial ref
... points = []
... lines = []
... polys = []
... fields = ["SHAPE@","var1","var2","var3","var4","var5","var6","var7","var8"] # geometry plus 8 variables
... maxDist = 5 # value multiplier
... with arcpy.da.SearchCursor(fc,fields,spatial_reference=sr) as cursor: # loop through features
...     for row in cursor:
...         centre = row[0].centroid # centre point
...         newPolyPoints = []
...         for i in range(1,9): # loop through variables
...             x = centre.X + math.cos(math.radians(i*45))*row*maxDist # x offset
...             y = centre.Y + math.sin(math.radians(i*45))*row*maxDist # y offset
...             newPoint = arcpy.PointGeometry(arcpy.Point(x,y),sr) # create point geometry
...             points.append(newPoint)
...             newLine = arcpy.Polyline(arcpy.Array([centre,newPoint.centroid]),sr) # make ray lines
...             lines.append(newLine)
...             newPolyPoints.append(newPoint.centroid)
...         newPoly = arcpy.Polygon(arcpy.Array(newPolyPoints),sr) # make snowflake polygon
...         polys.append(newPoly)
... arcpy.CopyFeatures_management(points,r'in_memory\points') # write points
... arcpy.CopyFeatures_management(lines,r'in_memory\lines') # write lines
... arcpy.CopyFeatures_management(polys,r'in_memory\polys') # write polygons
- Mark as New
- Bookmark
- Subscribe
- Mute
- Subscribe to RSS Feed
- Permalink
No but easy to replicate using python and matplotlib there are variants by name and specifics (aka radar, star)
api example code: radar_chart.py — Matplotlib 1.4.3 documentation in essence, you need magnitude and direction data and in your case, you join the points on the outer bounds rather than back to the center.
Be careful about the term star graph, since it also comes from a portion of graph theory, which probably isn't what you want... Star Graph -- from Wolfram MathWorld
Besides their snowflake is so lame, you can expand to variants raspberrypilearning/turtle-snowflakes · GitHub or even take it into fractal space
Some sample data would be useful
- Mark as New
- Bookmark
- Subscribe
- Mute
- Subscribe to RSS Feed
- Permalink
Here's how you can do it with arcpy geometries (10.1+):
>>> fc = "grid" # input feature layer
... sr = arcpy.Describe(fc).spatialReference # spatial ref
... points = []
... lines = []
... polys = []
... fields = ["SHAPE@","var1","var2","var3","var4","var5","var6","var7","var8"] # geometry plus 8 variables
... maxDist = 5 # value multiplier
... with arcpy.da.SearchCursor(fc,fields,spatial_reference=sr) as cursor: # loop through features
...     for row in cursor:
...         centre = row[0].centroid # centre point
...         newPolyPoints = []
...         for i in range(1,9): # loop through variables
...             x = centre.X + math.cos(math.radians(i*45))*row*maxDist # x offset
...             y = centre.Y + math.sin(math.radians(i*45))*row*maxDist # y offset
...             newPoint = arcpy.PointGeometry(arcpy.Point(x,y),sr) # create point geometry
...             points.append(newPoint)
...             newLine = arcpy.Polyline(arcpy.Array([centre,newPoint.centroid]),sr) # make ray lines
...             lines.append(newLine)
...             newPolyPoints.append(newPoint.centroid)
...         newPoly = arcpy.Polygon(arcpy.Array(newPolyPoints),sr) # make snowflake polygon
...         polys.append(newPoly)
... arcpy.CopyFeatures_management(points,r'in_memory\points') # write points
... arcpy.CopyFeatures_management(lines,r'in_memory\lines') # write lines
... arcpy.CopyFeatures_management(polys,r'in_memory\polys') # write polygons
- Mark as New
- Bookmark
- Subscribe
- Mute
- Subscribe to RSS Feed
- Permalink
Nice!!! remember this one next time someone asks a boring buffer question 
- Mark as New
- Bookmark
- Subscribe
- Mute
- Subscribe to RSS Feed
- Permalink
Thank you. That is exactly what I need to do.